OCOsense iPad App
The OCOsense Supervision can be downloaded from TestFlight upon request. It is used to connect to the OCOsense glasses and to record data. OCOsense Supervision is designed to be used by researchers, clinicians and other professionals.
Application Overview
To have all the functionalities of the OCOsense Supervision it is a must to have good and stable internet connection. The application has 6 main screens:
1. Login & Register Screen
Upon first opening, the app will show a login dialogue. Clicking ‘Register' will link to an external site in your browser of choice.
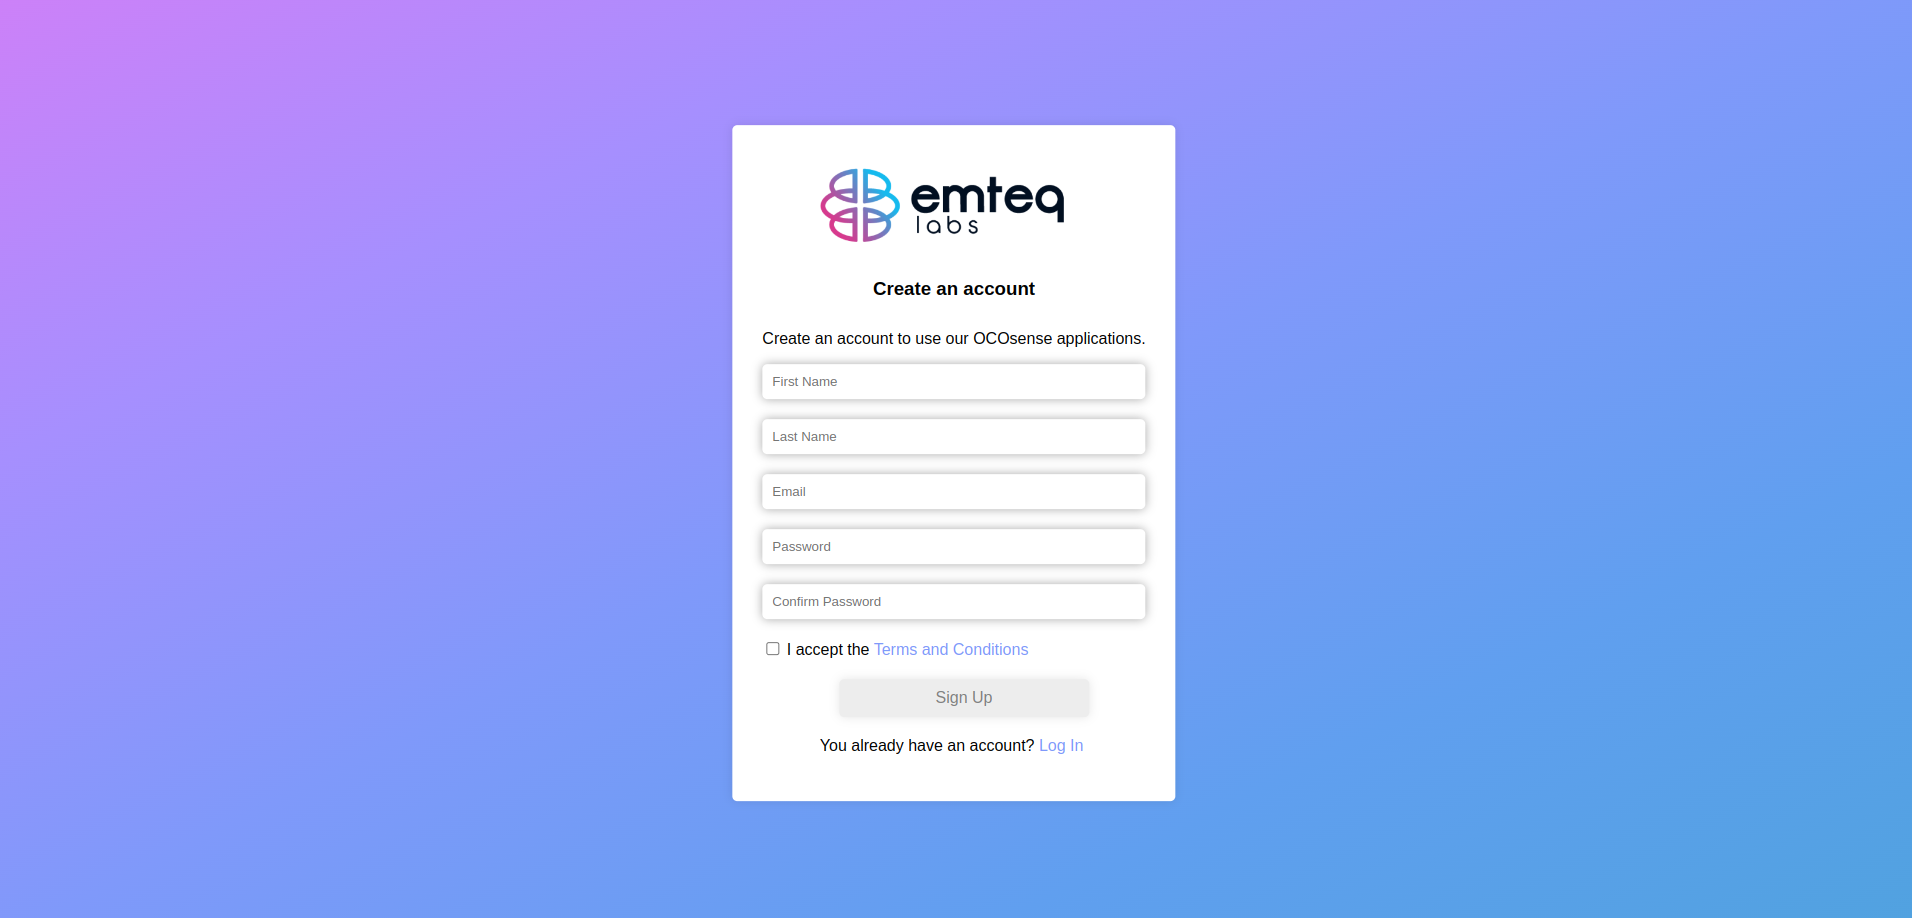
Enter forename, surname, email address and password and click ‘Submit'. A verification code will be sent to your email address. Enter the code and submit the form. You now have an account to login to the OCOsense Supervision.
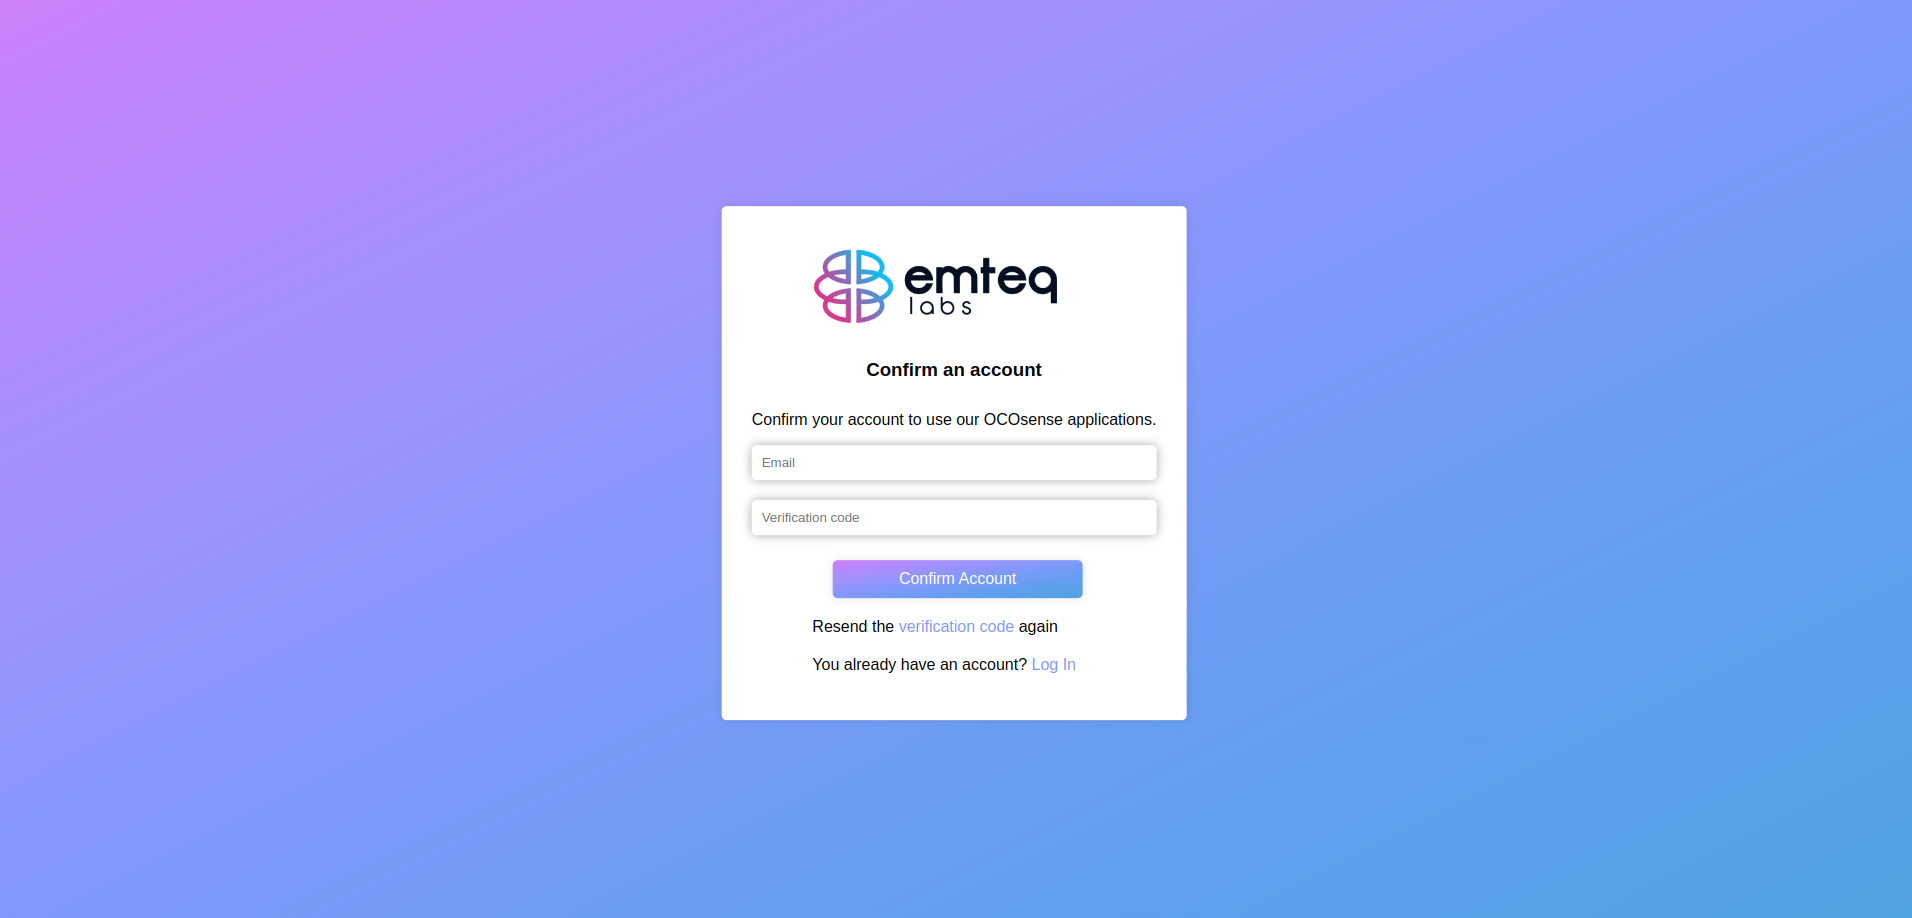
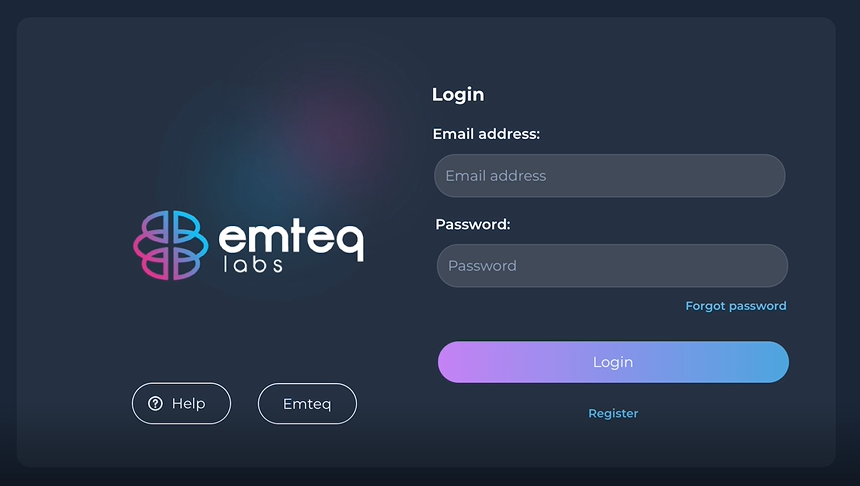
Upon returning to the OCOsense Supervision, enter your email address and password and click ‘Login'.
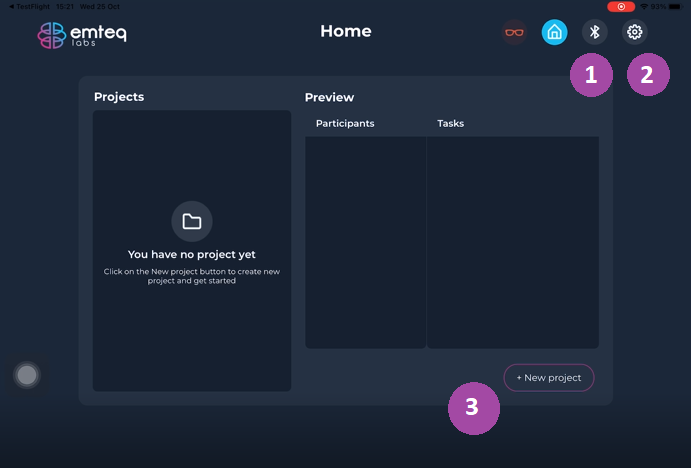
2. Home Screen
On your first login, from the home screen, you will be able to:
- Pair/connect the glasses and check connectivity(1)
- Open the Setting Screen(2)
- Create new project(3)
3. Connect Screen and Connecting Glasses
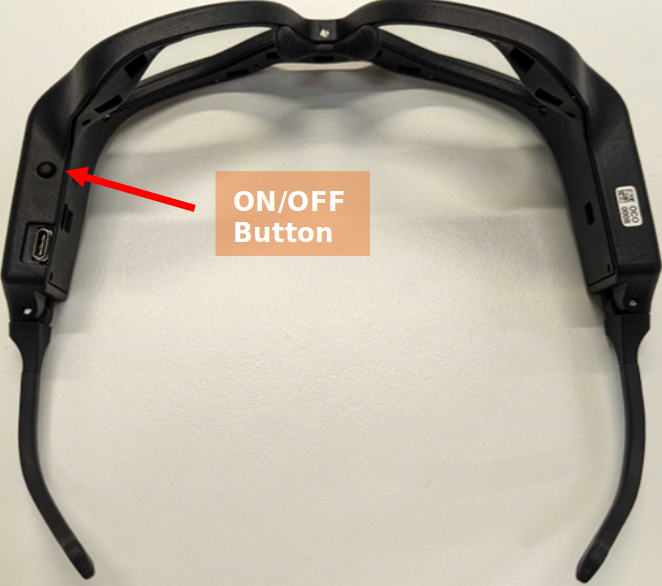
The first step is to turn of the glasses.
-
Turn the glasses on by pressing the on/off button. A yellow LED will flash at the nose bridge, and the glasses will vibrate. It may take a few seconds.
- Tap the Bluetooth icon (1, top right corner of the screen) to open the Bluetooth screen.
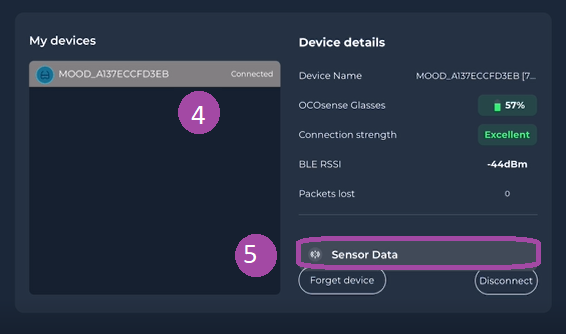
- If glasses are on, the device's name will appear on the left-hand side (4). Tap on the device's name to connect with the app. Once the connection is established, additional information will be shown on the right-hand side. The LED on the glasses will flash blue continuously whilst the glasses are connected.
- Device name: always communicate this reference when contacting support
- OCOsense glasses: battery level of the glasses. Note that it takes a few seconds for the system to check OCOsense glasses battery level. See table in section 8 for recommendations.
- Connection strength: the system checks the connection of the OCOsense glasses to the iPad
- BLE RSSI: represents the relative quality level of a Bluetooth signal received on the tablet. A higher RSSI value means a more robust signal.
- Packets lost: the amount of Bluetooth packets (representing OCO sensor data) that were sent from the OCOsense glasses but did not arrive at the user's iPad. See the table in section 8 for recommendations.
- Tap on the ‘Sensor data' button (5) to open the ‘Sensor Data'(Sensor) screen
4. Sensor Screen
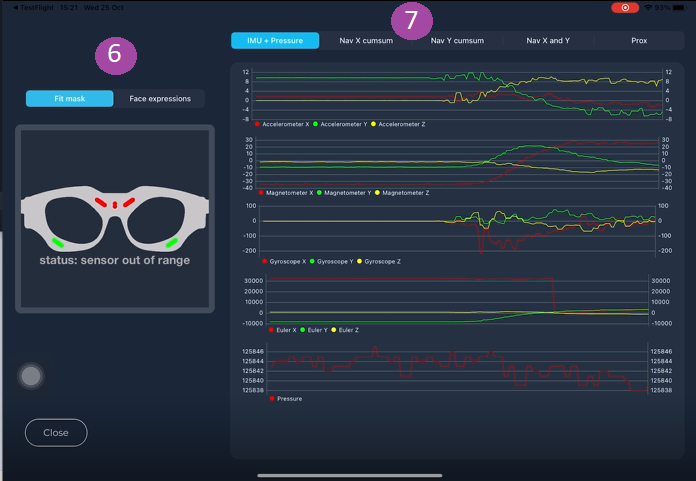
- On the left-hand side of the sensor data screen, you can swap between the ‘Fit mask' view and the ‘Face expressions' view (6).
- Fit view: For highest quality data, proximity sensors must not be further than 32mm (about 1.26 in) from the skin. The ‘Fit mask' view allows to check proximity of sensors with the skin. Red sensors mean sensors are out of range and green sensors means sensors are in range. Reposition the glasses until all sensors are green on the glasses icon.
- Face expression: This view allows to test that calibration was done correctly. Once a user is calibrated (see ‘Calibration' section below), the avatar will mimic the calibrated user's expressions.
- Check each data stream: Navigate through the different tabs (7) to see real-time data stream for all the sensors.
- Close the ‘Sensor Data' screen and tap the setting cog icon (top right).
5. Setting Screen
The Settings Screen provides the following information. See table in section 8 for recommendations.
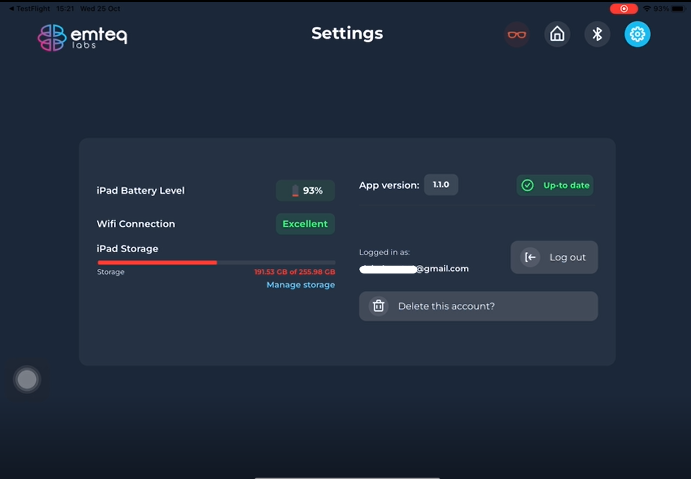
- iPad battery level: Check the iPad battery level before data collection to ensure all data can be recorded as expected.
- Wi-Fi connection status: A Wi-Fi connection is required to create projects, participants and tasks. However, if a project, participants and tasks and created ahead of data collection, the data collection can take place with no Wi-fi connection. The data will be temporarily stored on the iPad and will be automatically uploaded to the cloud when a Wi-Fi connection is established.
- iPad Storage: 2Gb of space is the minimum required to collect data. Always ensure you have enough space to store sensor data and video data, as in case of a poor internet connection, data will be temporarily saved on the iPad.
- App version: You can check if a new version of the app is available.
- Logout: You can logout from the Setting screen.
- Delete account: You can choose to delete the account and all the data associated with this account (data saved locally and, in the cloud,). This action is irreversible as we will not be able to retrieve deleted data.
6. Creating Projects/Participants/Tasks/Calibration Screen
A project consists of a task or series of tasks, and a number of participants.
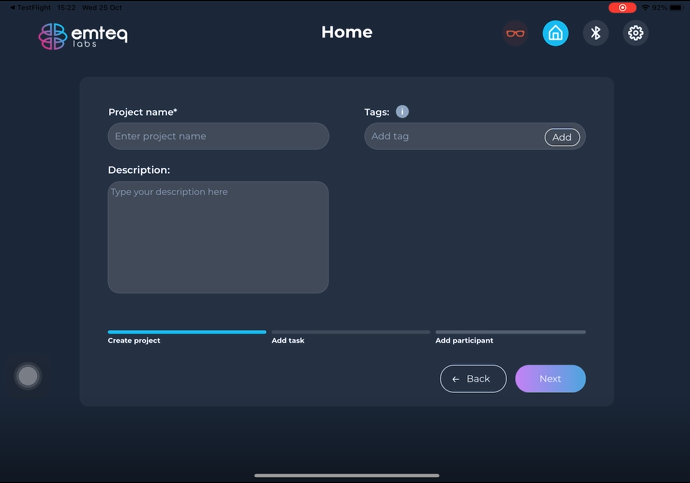
- Chose a unique Project name, you can add a short description of the project.
- Tags can be created during Project creation step and can be later applied to participants. For example, tags can be ‘control' ‘experiment' ‘male' ‘female' etc. The tag will be added to the meta data in the data file (more later).
- Click next to open the ‘Task screen'
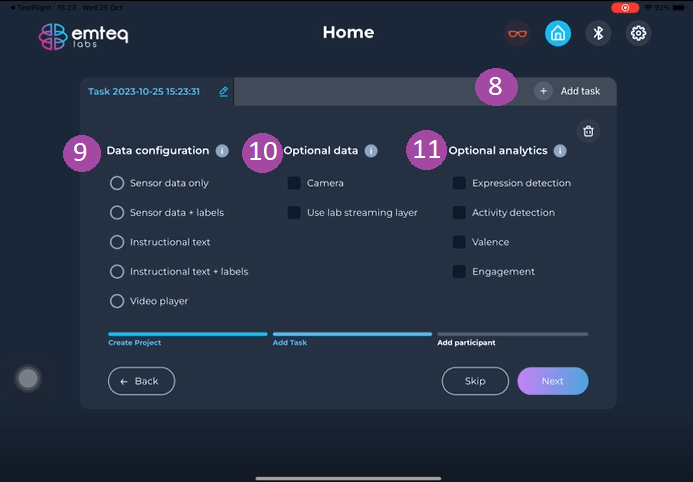
- Create your first task, we recommend editing the name using the small pen icon. You can create several tasks by tapping ‘Add task' (8, top right). For each task, you must choose a data configuration (9), for some configurations you can add optional data (10) and optional analytics (11). Tasks can be also added later, once you have the project configured only with the first task. It is important to note that the tasks are project specific, and all participants defined in the project will see the same configured tasks.
Data configuration(9):
- Sensor data only: only sensor data from the OCOsense glasses will be recorded. Sensor data is automatically uploaded to the cloud. If internet connection drops during the data collection, data upload will be done automatically when a connection is established.
- Sensor data + labels: sensor data from the OCOsense glasses will be recorded and the researcher or participant will be able to add label to sensor data by tapping on labels the researcher will have created.
- Instructional text: the research can upload a text for the participant to read or follow, while sensor data from the OCOsense glasses is recorded.
- Instructional text + labels: in addition to showing a text on screen, researcher or participant will be able to add label to sensor data from the OCOsense glasses by tapping on labels that were previously created.
- Video player: the researcher or participant can select a video from the local storage of the iPad to be displayed while sensor data from the OCOsense glasses is being recorded. The video is automatically started when the researcher or participant presses the record button. This guarantees that the video shown is synchronized with the sensor data from the glasses. The video played during data collection is not uploaded to the cloud.
Optional data (10):
- Camera: can be selected with ‘sensor data only' and with ‘video player' data configurations. The researcher can choose to also record videos using front-facing or back camera of the iPad to record the face of the participant, or some contextual information. Choosing back or front camera happens at the beginning of data collection and cannot be changed during data collection with a participant. Video data recorded is uploaded to the cloud, together with sensor data. The camera recording is synchronized with the sensor data coming from the glasses. Additionally, when used in combination with ‘video player' configuration, the sensor data, video played on the iPad and the camera recording are all synchronized.
- Use Lab Streaming Layer: this option allows the user to stream the OCOsense glasses sensor data with Lab Streaming Layer when having the specific task (with selected Lab Streaming Layer option) opened. This allows the participant to use the OCOsense glasses in combination with other devices where synchronization between them is required. For more details about Lab Streaming Layer check https://labstreaminglayer.org/synchronise sensor data with other data.
Optional analytics (11): Insights can be added to sensor data.
- Expression intensity is the current size of expression recognized by the analysis
- Expression certainty is how confident the analysis is of its recognition results
- The higher statistics from the analysis are:
- Attention (time spent attending to the screen)
- Expressivity (time spent in recognised expressions)
- Interaction (amount of screen interaction)
- Valence (positive vs negative expressions over time)
- Engagement (a combination of expressivity & attention)
Once a task, or several tasks have been created, you can add your participant(s). More tasks can be added to the project at any time.
- Enter the name (or ID) of your participant. You can add some additional information about the participant, and assign tags previously created. Click save to add more or start the calibration or data collection. Additional participants can be added once you have the project configured.
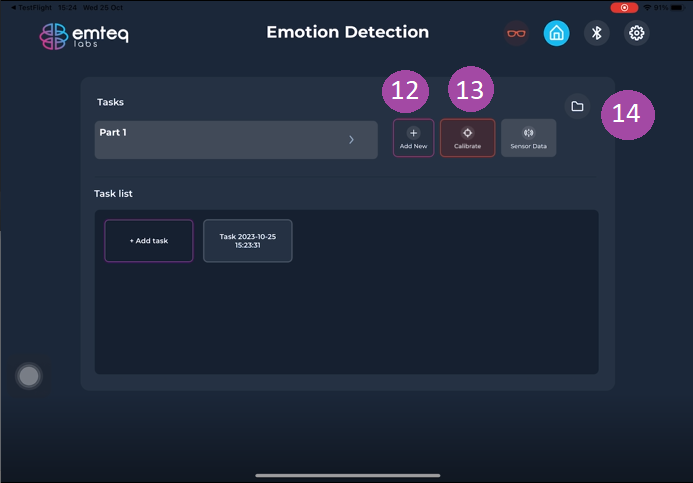
- From the participant's screen, you can add more participants by tapping ‘Add new' (12). You can select another participant by clicking on the participant's name or ID and chose from a list of participants.
- Calibration is required to get expression detection insights. For any additional statistics and analysis of the participant the calibration is required to be done. Also, as a researcher you want to do some specific algorithm development using the data from the glasses, it is recommended to do calibrations, which will provide you with more context and information about the participant. To calibrate a participant, tap the ‘Calibrate' button (13).
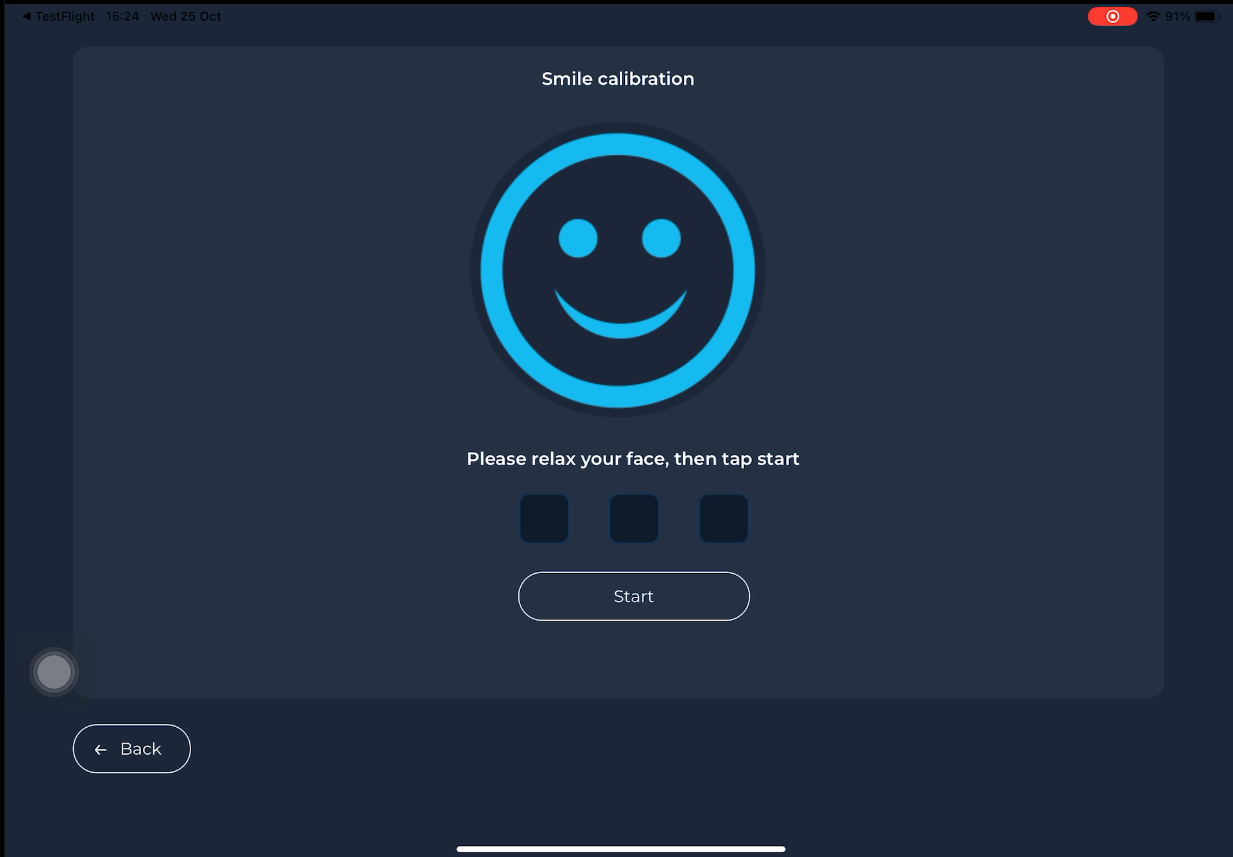
- Three expressions can be calibrated: smile, frown and brows raise. A red dot on the top right of card indicates that the expression was not calibrated for this user, a green dot indicates that the expression is calibrated for this user. The calibration file is saved locally on the iPad and associated with the participant ID. If a participant comes several times for data collection, it is not required to perform the calibration several times.
- For each participant, the list of existing files can be checked by tapping the folder icon (14, top right), together with the status of the upload.
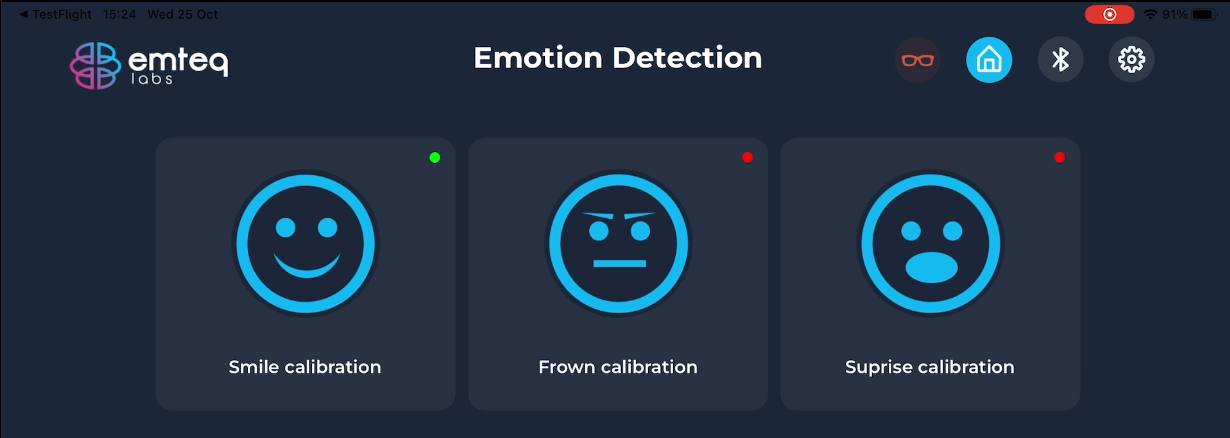
- To calibrate an expression, the expression must be performed 3 times.
- Participant starts in neutral / relaxed position and follows instructions on screen
- Participant presses ‘START' when ready to record the expression
- A 3-second timer starts when an expression is detected. The timer stops if the expression is not sustained for 3 seconds, in which case, the user must restart the expression. If the expression was sustained, the timer stops at the end of the 3 seconds and the participant can continue the calibration.
- Note that a vibration from the glasses during calibration means that the glasses need a reset. This will also be instructed on the screen. The participant must take a neutral expression and the reset will be done automatically.
7. Recommendations and Risk Indicators Screen
The icons on the top right are always visible and provide information on platform's readiness for data collection.

| Icon | Component | Green No dots | Amber | Red | |
|---|---|---|---|---|---|
| Glasses | Glasses State | Ready | Resseting | Need reset | Hold neutral face for a few seconds, until glasses vibrate, and icon turns green |
| Bluetooth | Bluetooth RSSI Calculated in dBm (decibel-milliwatts) | RSSI > -55dBm | RSSI -67dBm | RSSI < -90 dBm | Move your device closer to the OCOsense glasses, remove obstacles between device and glasses, ensure the glasses have more than 20% battery and try again. You can check the average lost frame per minutes on the Settings page. |
| Bluetooth packets lost frames per minute with every incoming frame, checked every 20 ms. Information | Threshold: 0 to 1% data loss | 1.01% to 5% | 5.01% and above A pop up will inform of critical loss during data collection. | Move your device closer to the OCOsense glasses, remove obstacles between device and glasses, ensure the glasses have more than 20% battery and try again. You can check the average lost frame per minutes on the Settings page. | |
| Glasses battery | >30% | 20% to 29% | 20% A pop up informing of low battery will be shown during data collection, with possibility to continue data collection | To ensure best quality data, we recommend using glasses with at least 30% battery life. Please plug in the glasses. | |
| Settings | Glasses proximity to face during calibration | <32mm | N/A | >32mm | Sensors are out of range and this calibration was not saved. Please reposition the OCOsense glasses and try again. You can use the fit view in Settings to ensure good positioning of the glasses. |
| Glasses proximity to face during data collection | <32mm | N/A | >32mm | Sensors are out of range. Data is being recorded but we recommend to reposition the OCOsense glasses. You can use the fit view in Settings to ensure good positioning of the glasses. | |
| iPad storage during data collection | >10GB | 2 to 9.99GB | <2GB | The storage of the iPad is running critically low. This may result in data not be saved. Please delete some files to increase storage capacity. |
Before collecting data or when encountering issues, always:
- Check if there is internet connection and the signal is strong.
- Check Bluetooth connectivity from Bluetooth screen
- Check Glasses are connected via Bluetooth (flashing blue)
- Glasses have good battery level(35% or higher). It is ok to collect data while glasses are plugged in to a power source
- iPad has good battery level(35% or higher).
- iPad has enough storage for your need, for temporary storage of data collected.
- Glasses are well positioned on the face
- Check the iPad won't auto-lock as data will stop being collected recorded