SuperVision Usage Guide
In order to view data within the SuperVision application you will need to be running the Emteq SDK to process and record data from the emteqPRO mask. This can be acheived by building a Unity app with our Emteq SDK or by downloading one of our pre-baked demo apps that you can use to get started quickly and reference in future.
Ensuring Good Signal
Preparation
In order to have successful data collection there needs to be good contact with the sensors. Some tips on best to achieve this can be found here.
The EMG sensors
The mask, shown below this list, contains 7 electromyochartic (EMG) sensors. These namely are:
- Frontalis: Left and right side of the forehead
- Orbicularis: Left and right side of the eyes.
- Zygomaticus: Left and right side of the cheeks.
- Corrugator: Measures the corrugator and procerus in the midline.
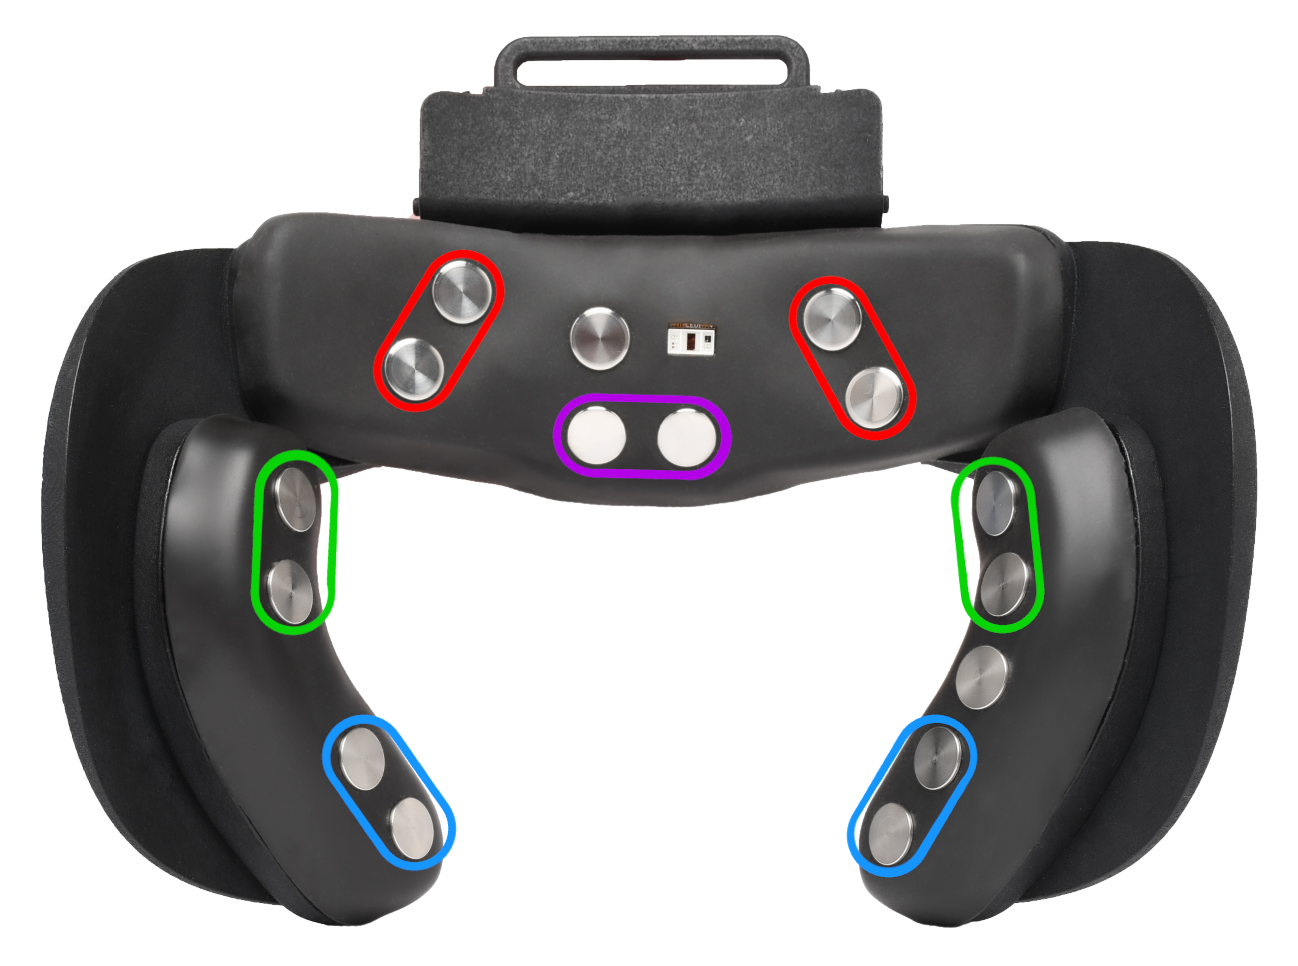

The zygomaticus and orbicularis sensors are part of adjustable sides which can be inserted into the mask. Ensuring the right size-side insert for your face will greatly improve the sensor signal.
The orbicularis sensors should be placed as close to the end of the eye as possible, as long as they are not affecting normal eye movements or comfort. Note, on some faces using the wide inserts may mean the orbicularis sensors placed further away from the eye and thus give weaker signal.
Problems with sensor contact
The SuperVision app uses a traffic light system to help provide a quick indication of sensor contact. The mask icon displayed in the application shows sensors in three different states: grey (no connection), orange (bad connection) and green (good connection). If you are struggling to find a good connection with the sensors after readjusting you can do a few things to help.
After you fit the device, try leaving it on the face for a brief period of time before starting any data collection. We recommend 15-20 seconds. This duration may vary depending on the conditions of the recording. After this step, check the mask diagram on the SuperVision app, if all sensors are green then you have good contact. Generally sensor conductivity may improve over time.
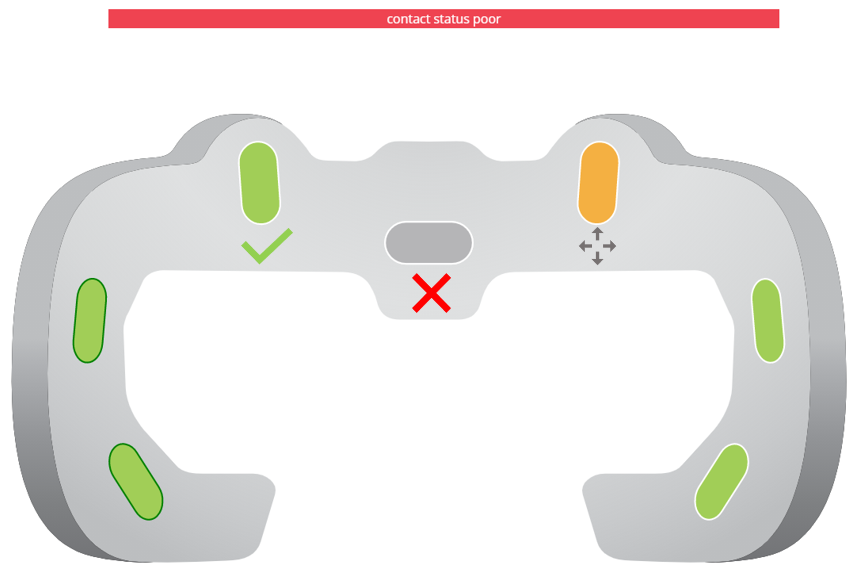
Green sensors indicate good connection with the skin.
Orange sensors indicate low/poor skin contact.
Grey sensors indicate no contact with the skin.
See all possible colour indications in the above image.
To achieve stable contact with the skin, try repositioning the device, tightening the head strap, or changing the sensor inserts (wide or narrow inserts for the eye sensors).
It is important to ensure all sensors have good contact with the skin before recording any data.
Please check the sensor placement (see The EMG Sensors). If any of the sensors are still not green please try the following steps:
- try lowing the device slightly, to avoid the sensors being placed on the curvature before the hair line. Different face shapes and may need extra attention for the brow sensor set up.
- Remove any hair or products that might be trapped under the sensor in that area. You can use alcohol swabs to clean the area under the sensor and the sensors themselves. For researchers, it is advisable that all participants cleanse the skin beforehand.
- To minimise electric potential interference, move to an area which has less electrical cables (e.g., laptop chargers, multi-plugs). You can also try switching off additional monitors or other devices in close proximity. The effect should be instantly visible on the streaming impedance signals on the Terminal app.
- Press the device slightly against the skin as this sometimes creates long-lasting contact between the skin and sensors.
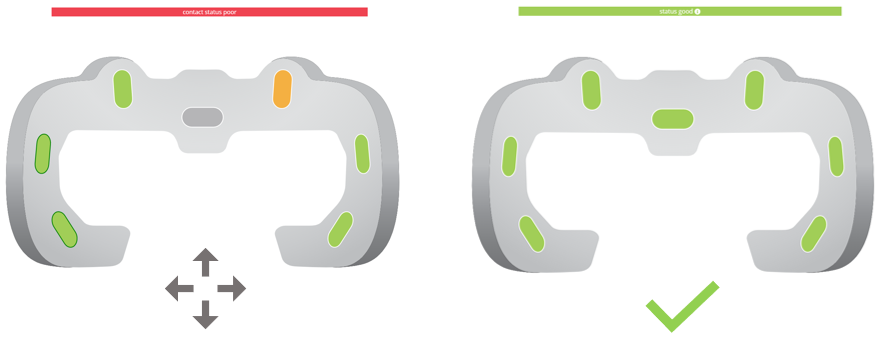
The tab at the top indicates the status contact.
If any sensors are not touching or showing as orange, the tab will say ‘contact status poor' and the mask needs readjusting. Once all sensors have good contact with the skin, the tab will show as ‘status good', then you are able to continue with data collection.
Using SuperVision
When monitoring active recording sessions this is the main display you will use for reading the real-time data. It contains information on all sensors organised into charts which can be customised to fit your needs.
Mask Fit
Once connected to the emteqPRO device, you will see live signals coming through from each of the sensors. 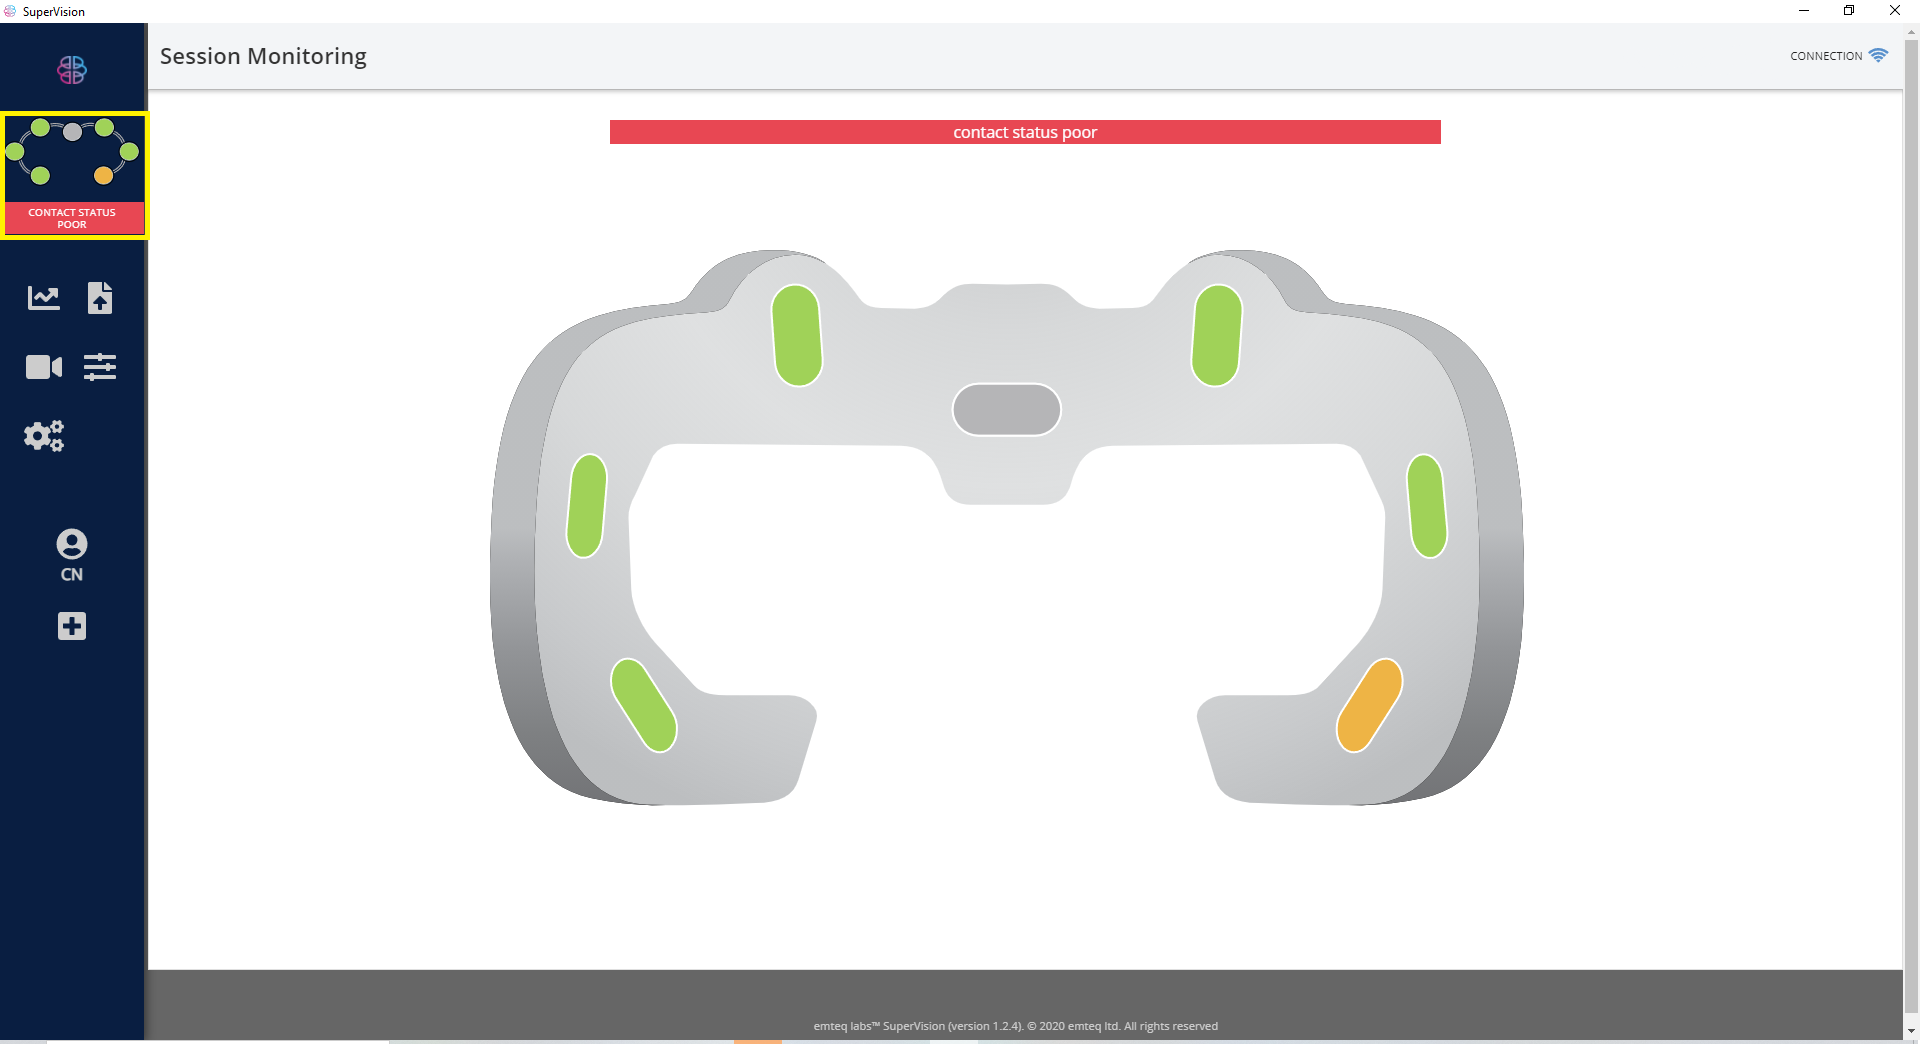
Sensor Charts
To see the signals, click the second tab on the left with the chart icon. 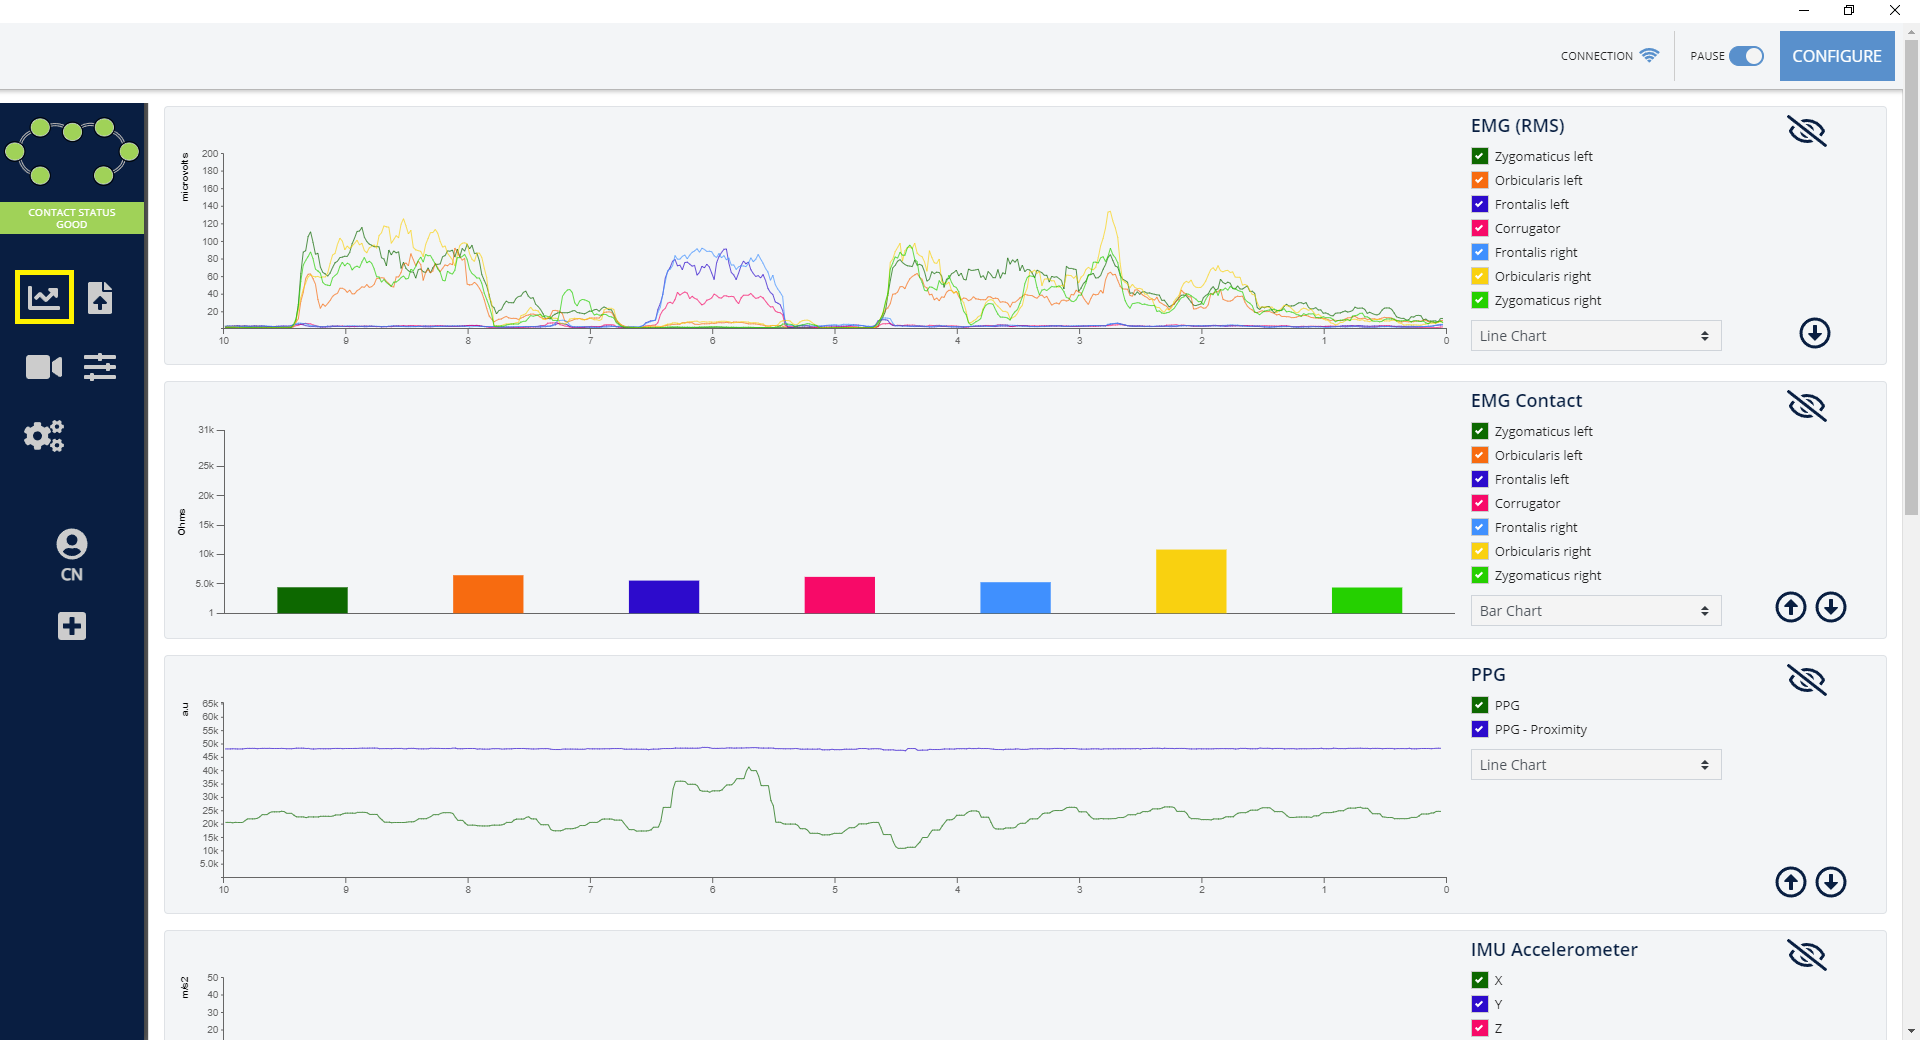
You are able to view EMG, PPG, IMU accelerometer, magnetometer, gyroscope and HR in beats per minute (BPM), the charts are shown below. 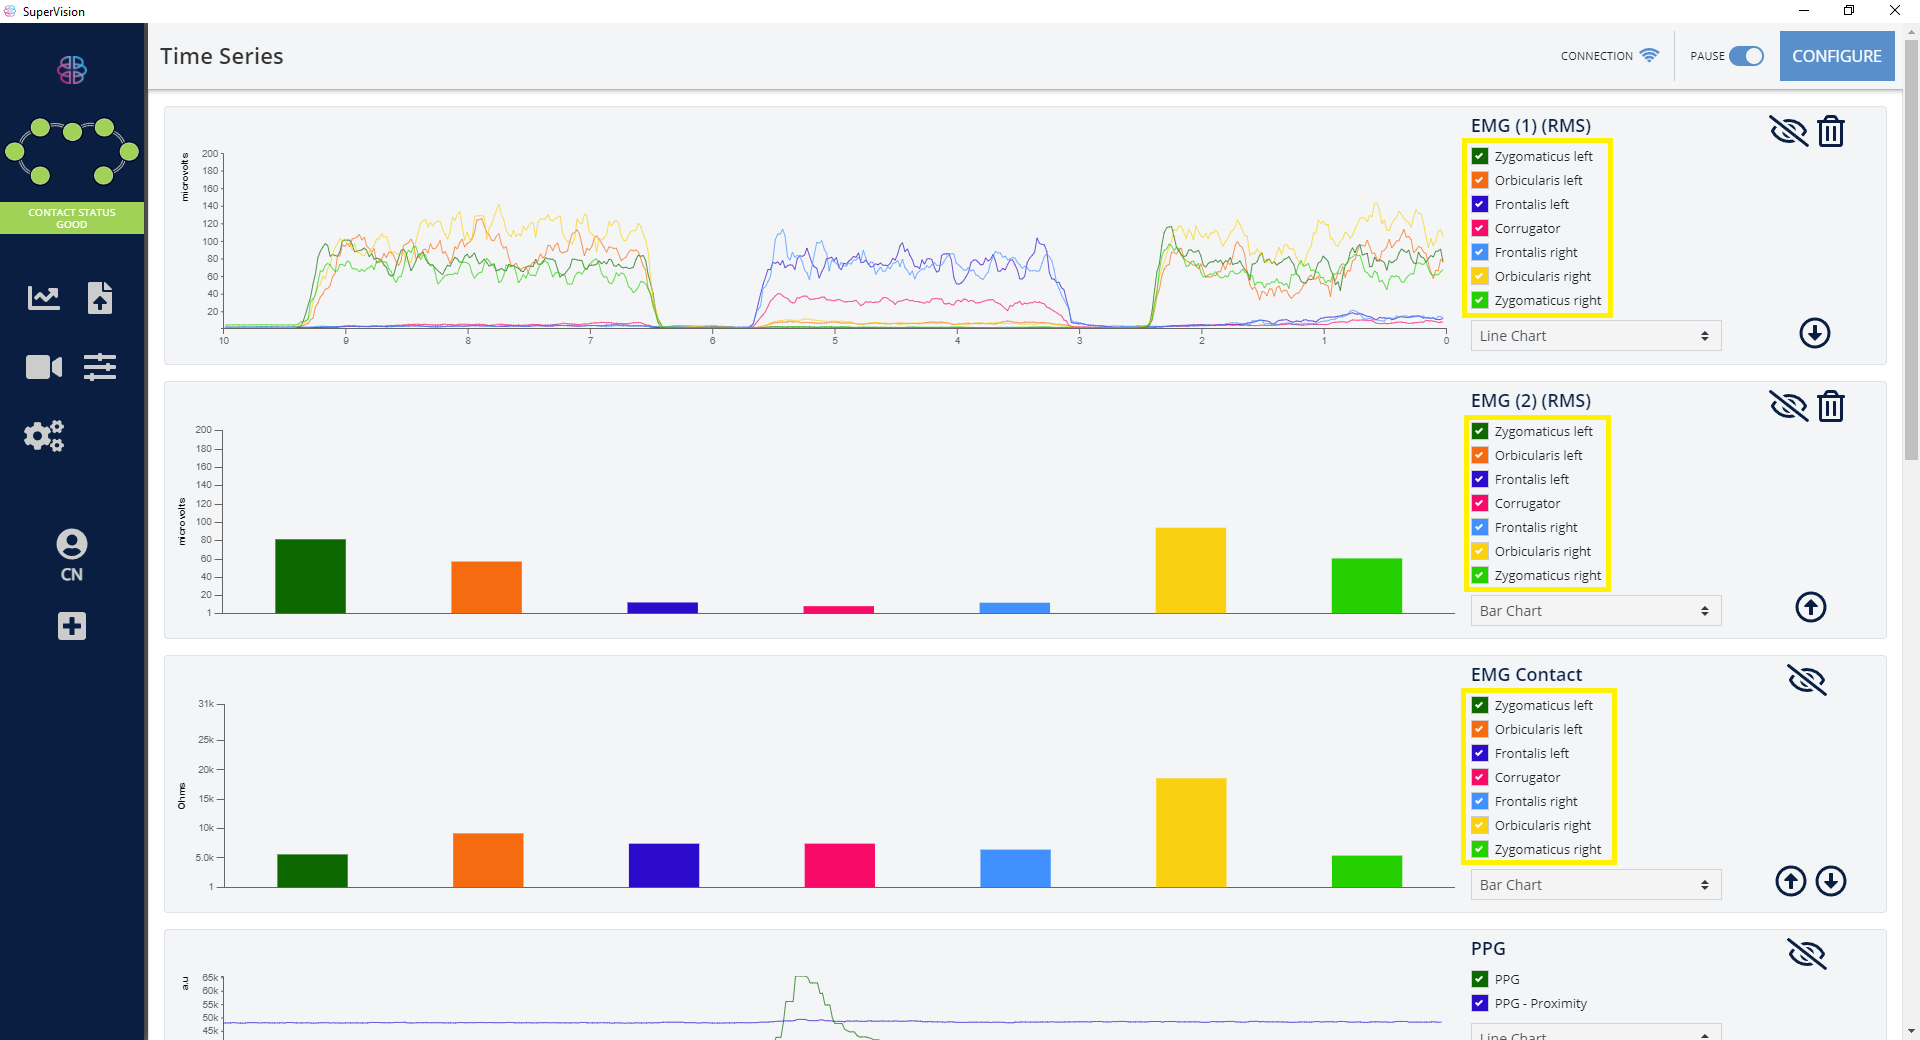
On each chart you are able to select which channels you want to view and the position of the chart on the screen. 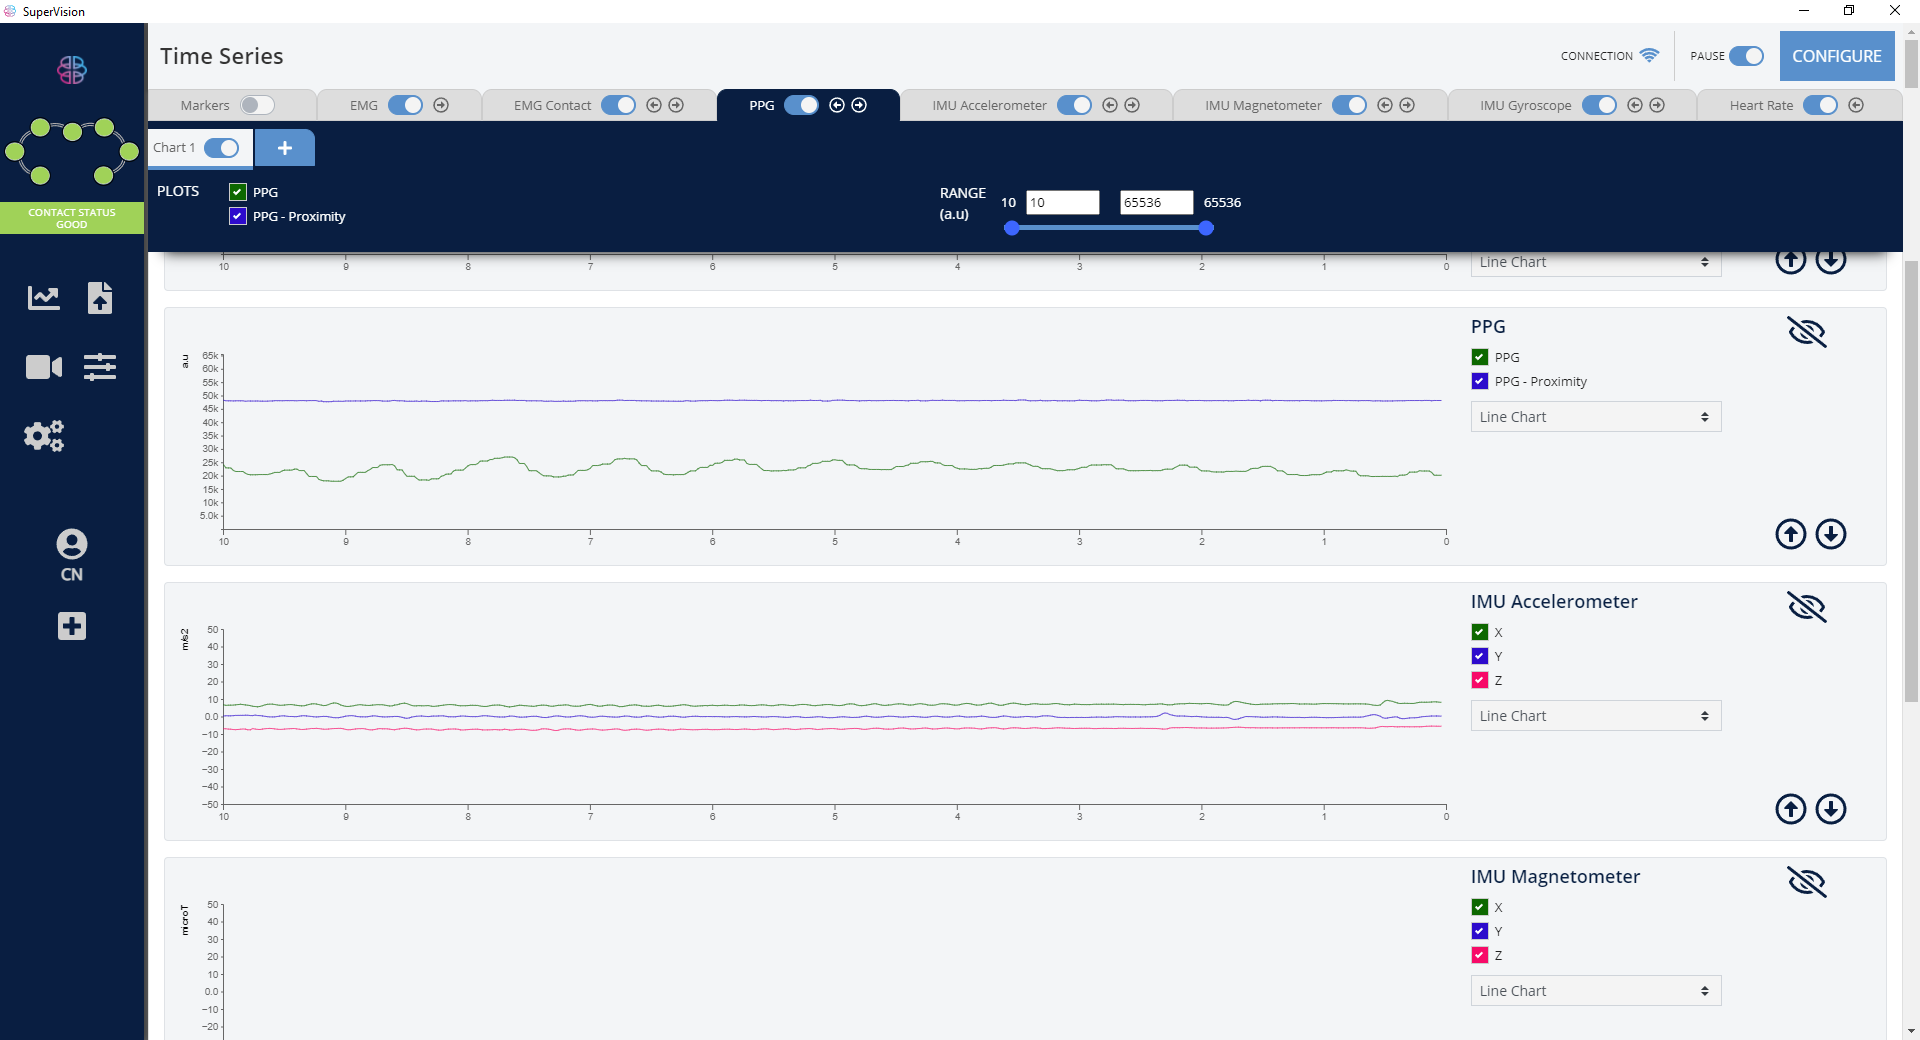
You are also able to edit the charts using the configure button in the top right corner. This feature allows you to select which channels you want to view, change the amplitude range and apply filters to the signals. 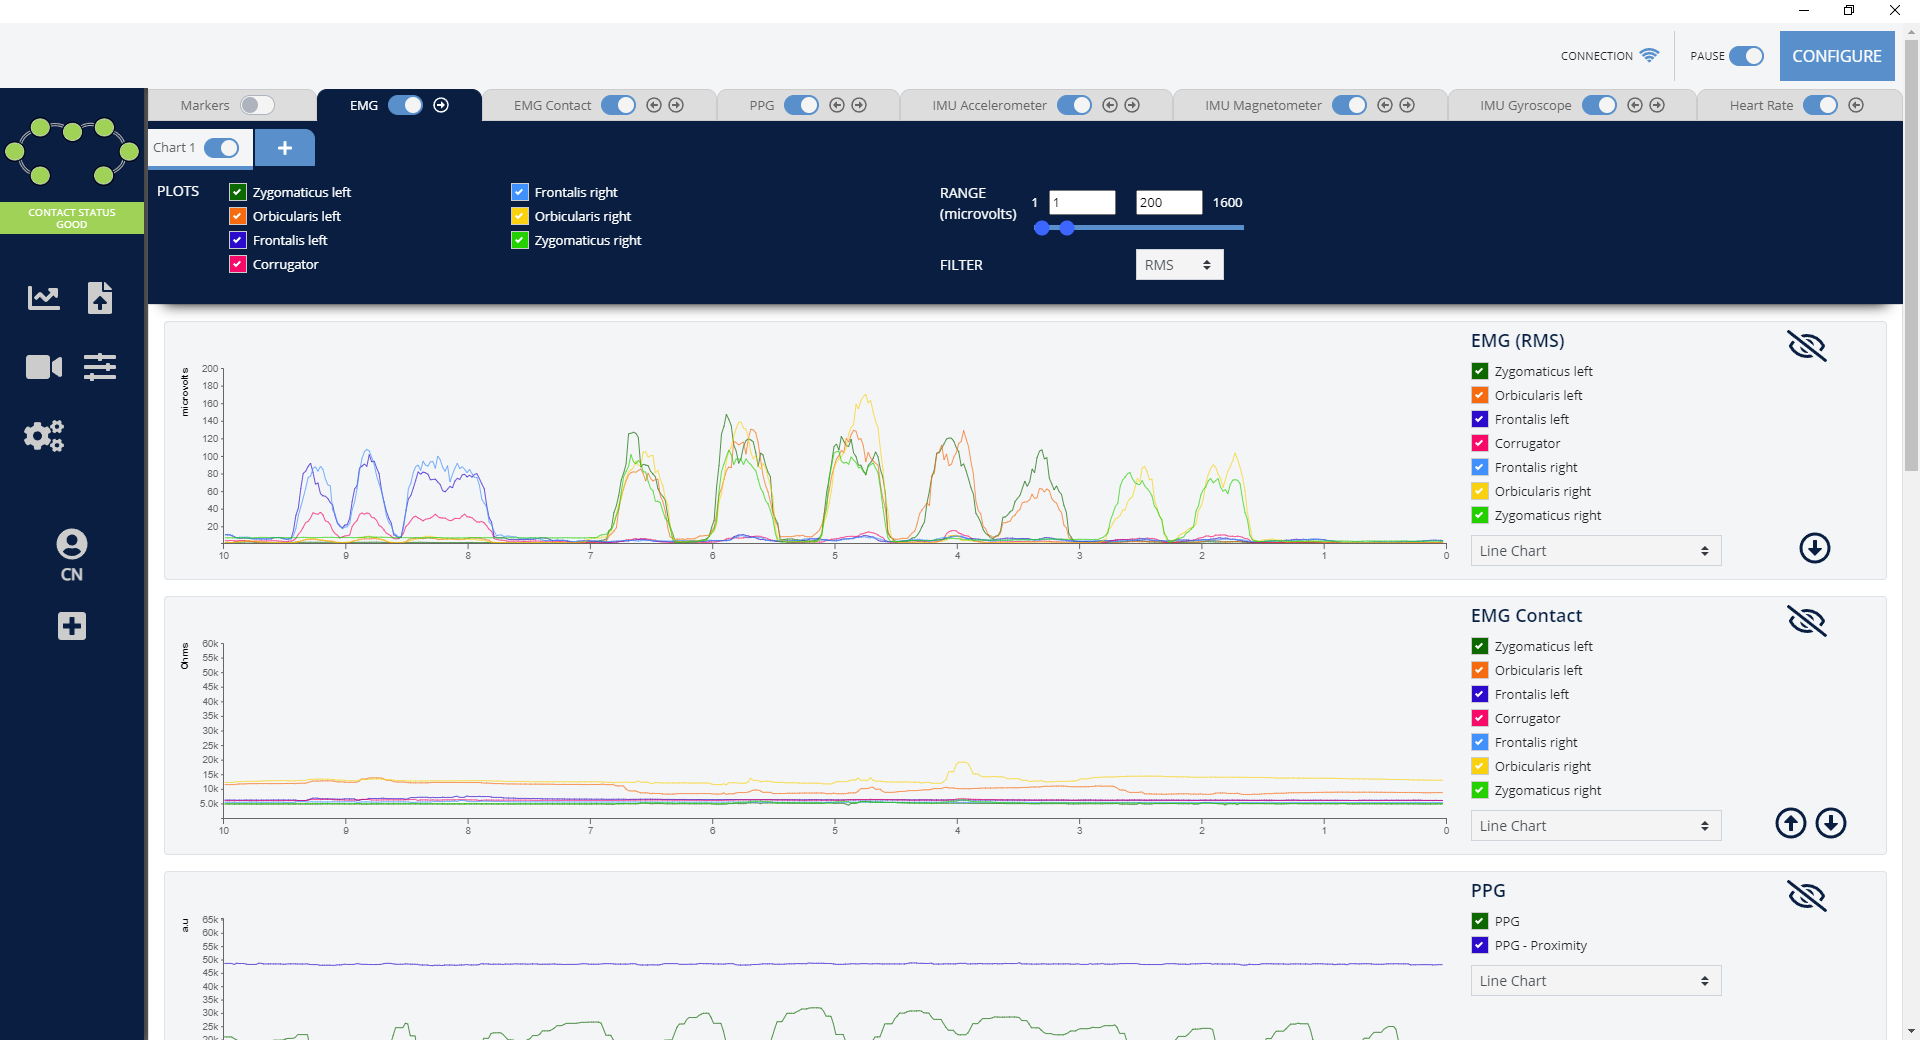
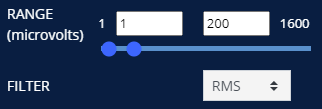
From within each chart configration you may use the ‘Range Slider' to manually control how the data for each sensor is displayed within the charts. With manual input fields for min and max values and a slider allowing for easy changes and consistent views between the charts.
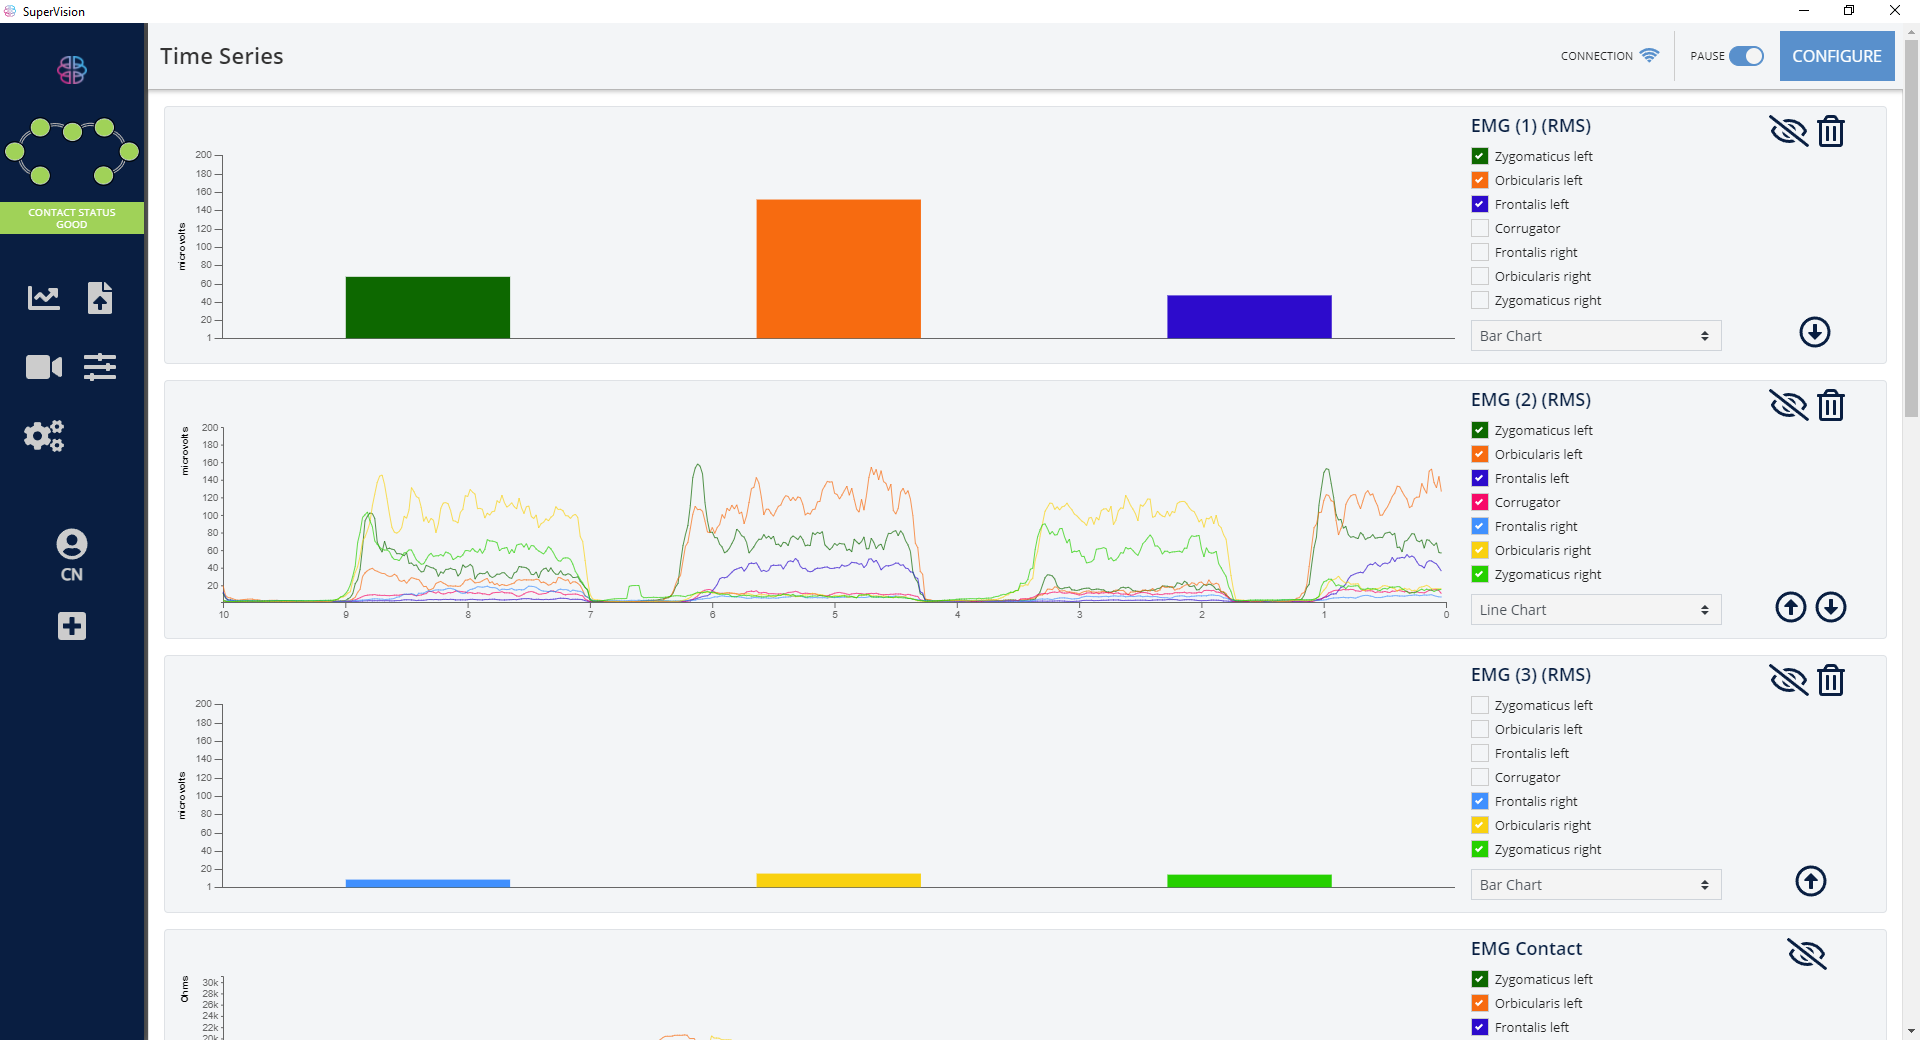
Certain charts can be viewed as either a Line Chart of Bar Chart, as shown below. Bar Chart provides an alternative, instant view on real-time channel data.
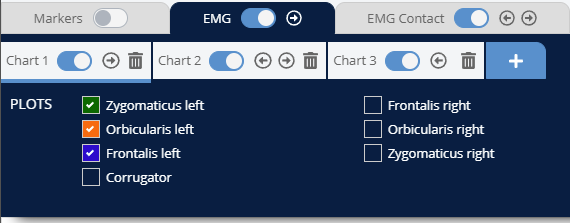
Chart duplication controls have been added, allowing for much greater flexibility of the configuration. These will appear on top left as new options under the selected channel. For each duplicate chart, you can control the appearance, the type of data or channels visualised, without affecting the remaining graphs. Settings configured per chart are saved between uses.
Some examples of how this can be used are showing the left and right sides of the face in two charts to compare channel readings side by side. Or you may have a chart that shows a narrow range of values giving a very granular view of micro-expressions, while also having a chart with a wider range for a more general view. Under the Configure menu you will find the option to create, move and close additional charts. You may create as many charts as there are plots in a channel. EMG for example has 7 pairs of sensors, so you can create a total of 7 charts.
To improve performance on a lower end machine it is recommended to disable any chart sensor data you are not currently using, for example removing IMU or Magnetometer, or removing Corrugator from EMG if only the two sides of the face are required.
Event Markers
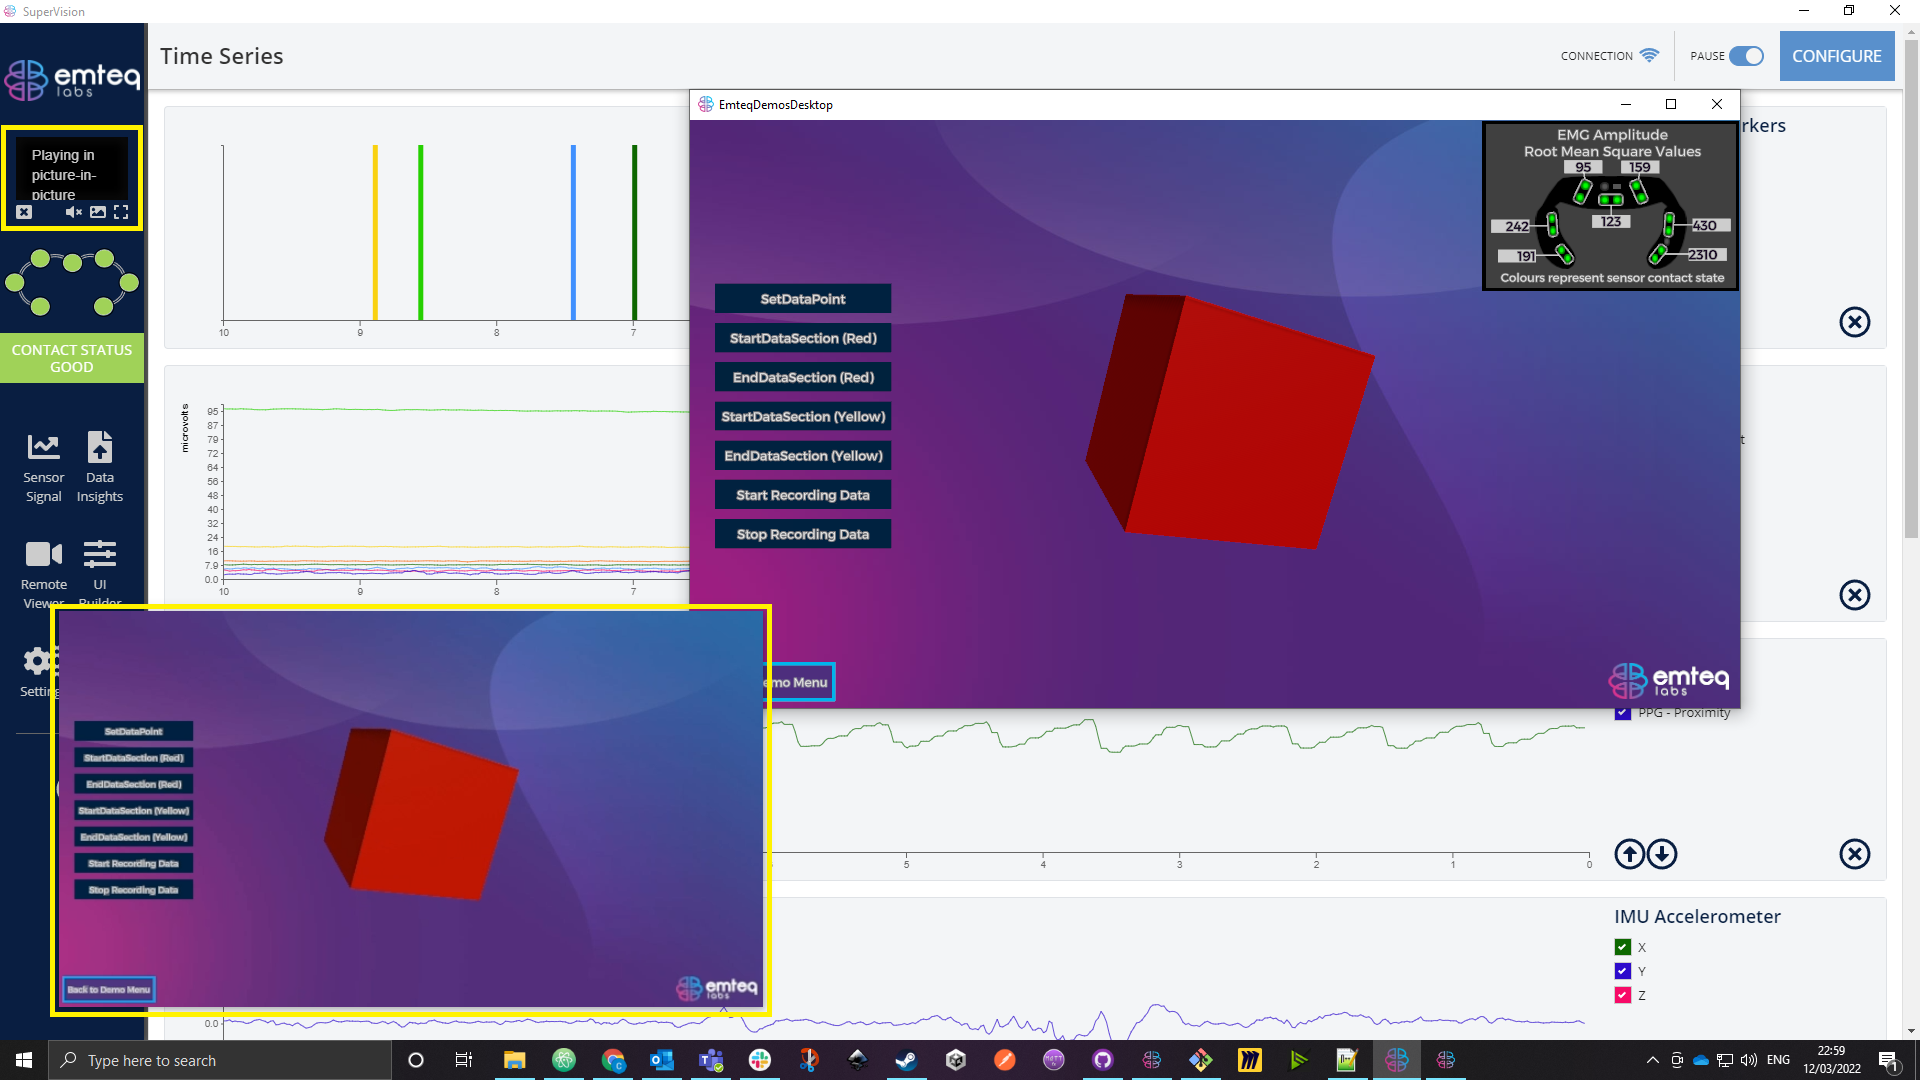
There is also a chart for viewing the event markers the user is experiencing in real time. These events are triggered from the emteq SDK app, but can also be triggered from SuperVision such as session recording below. 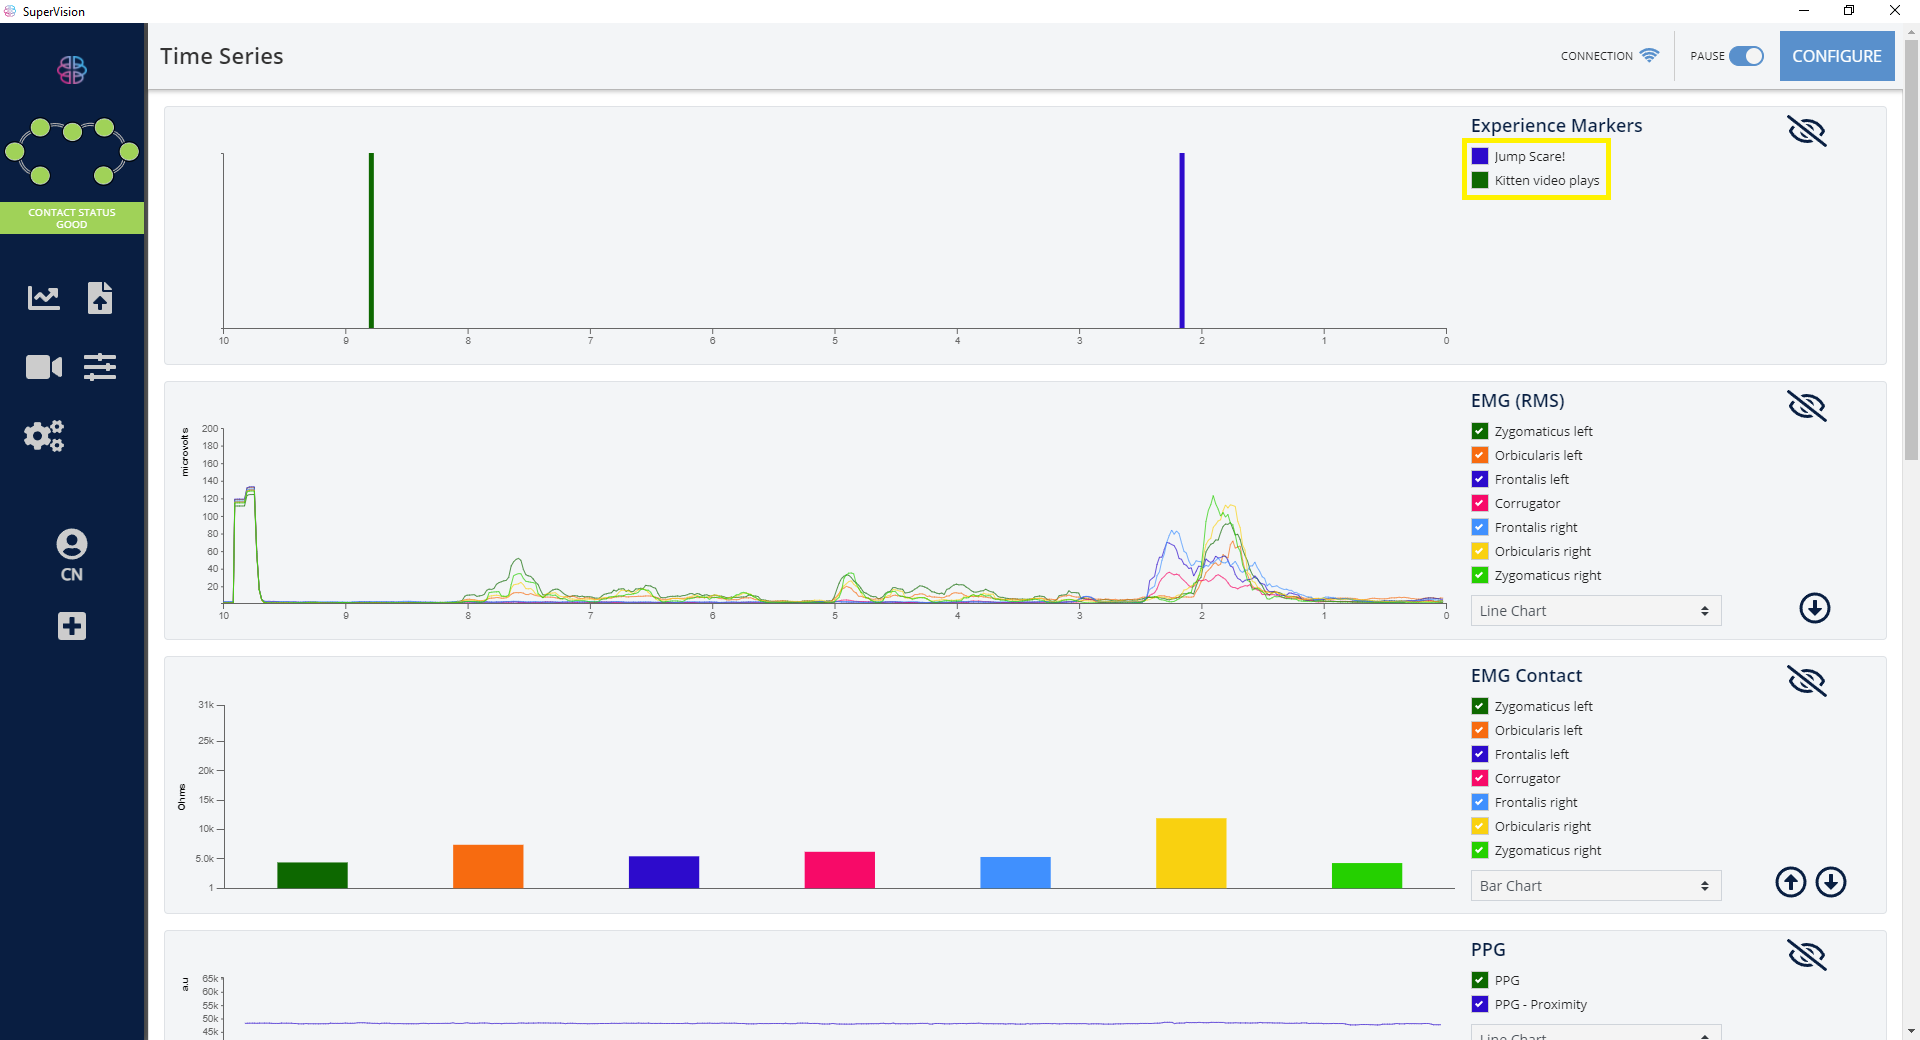
Connection
The connection icon on the top right of the SuperVision shows the connection with the emteqPRO Mask. If connection is lost, and the mask is not recognised by the SuperVision, then the icon will turn from blue to red, as shown here. 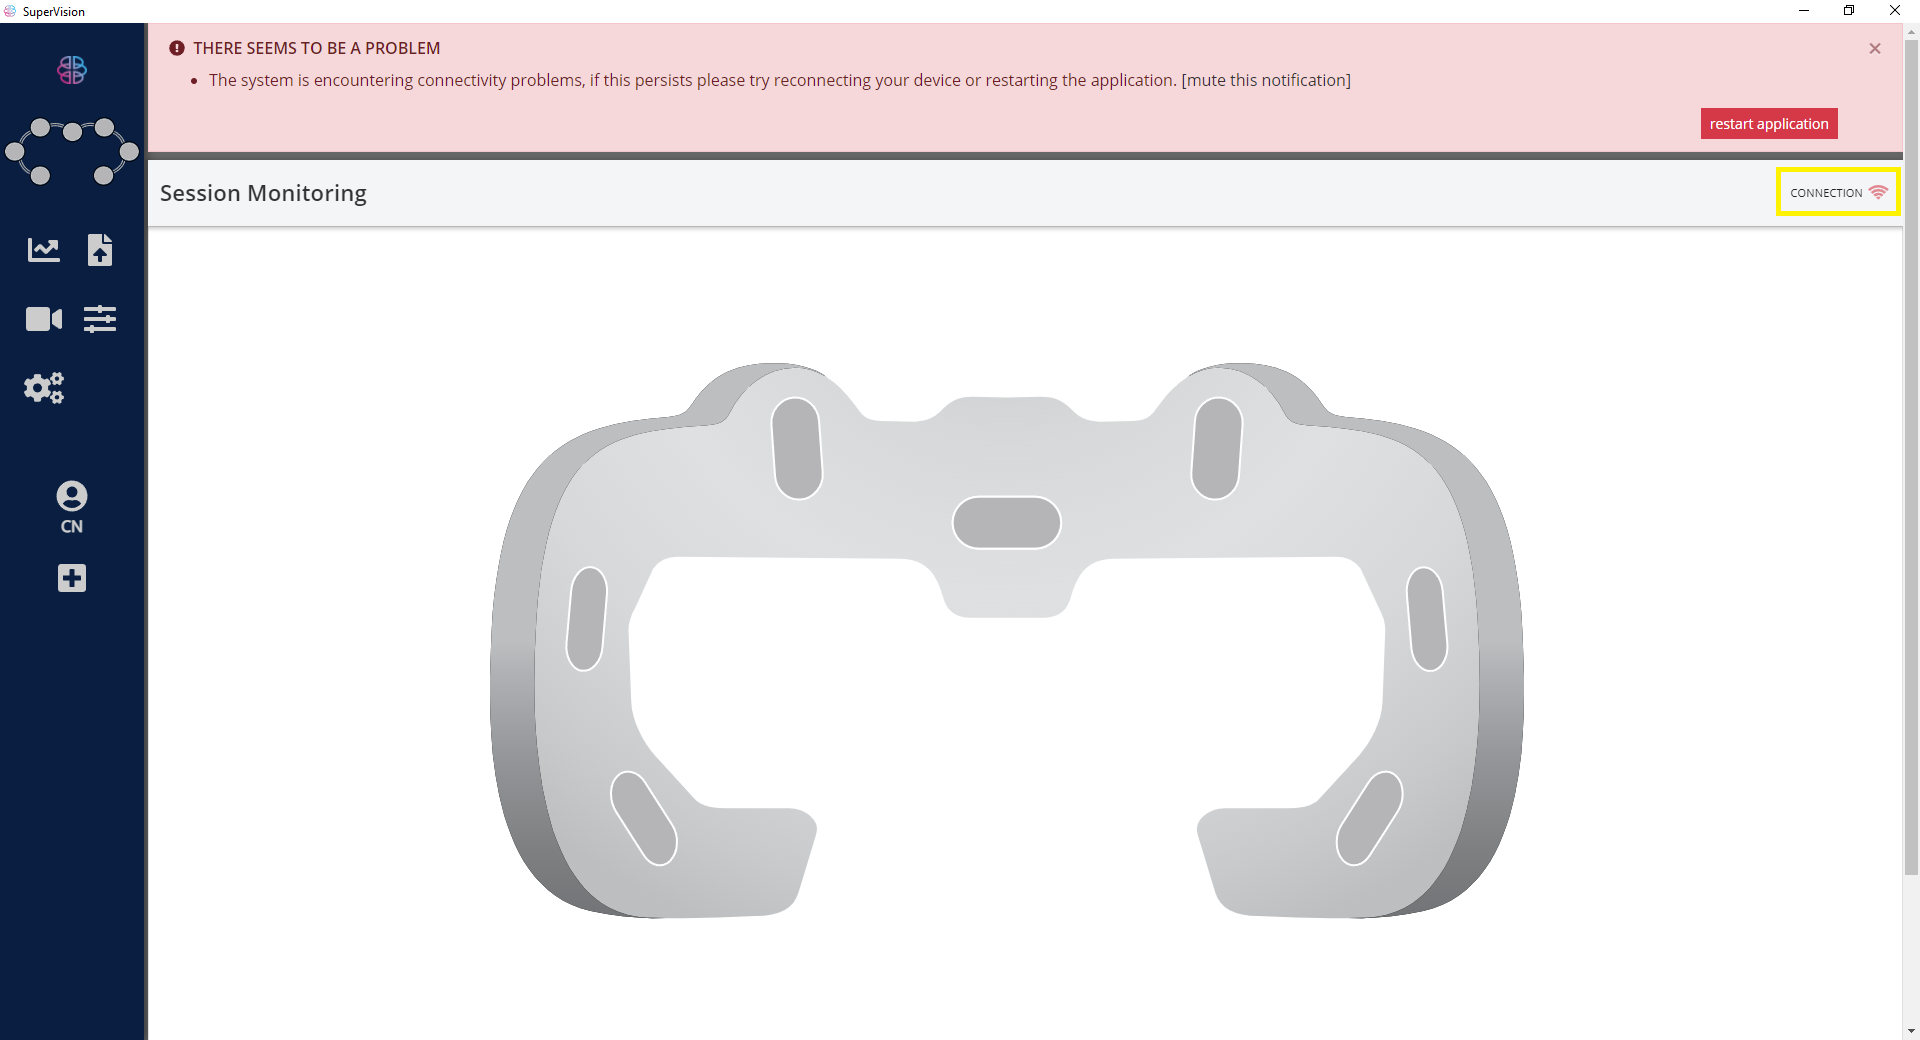
Data Insights
The Data Insights section allows you to upload your data to the cloud where the data to be processed and returned as a batch of standard CSV files in a compressed zip format. You can access the Data Insights section at any time from the tab on the left of the SuperVision app, even when not connected to the mask.
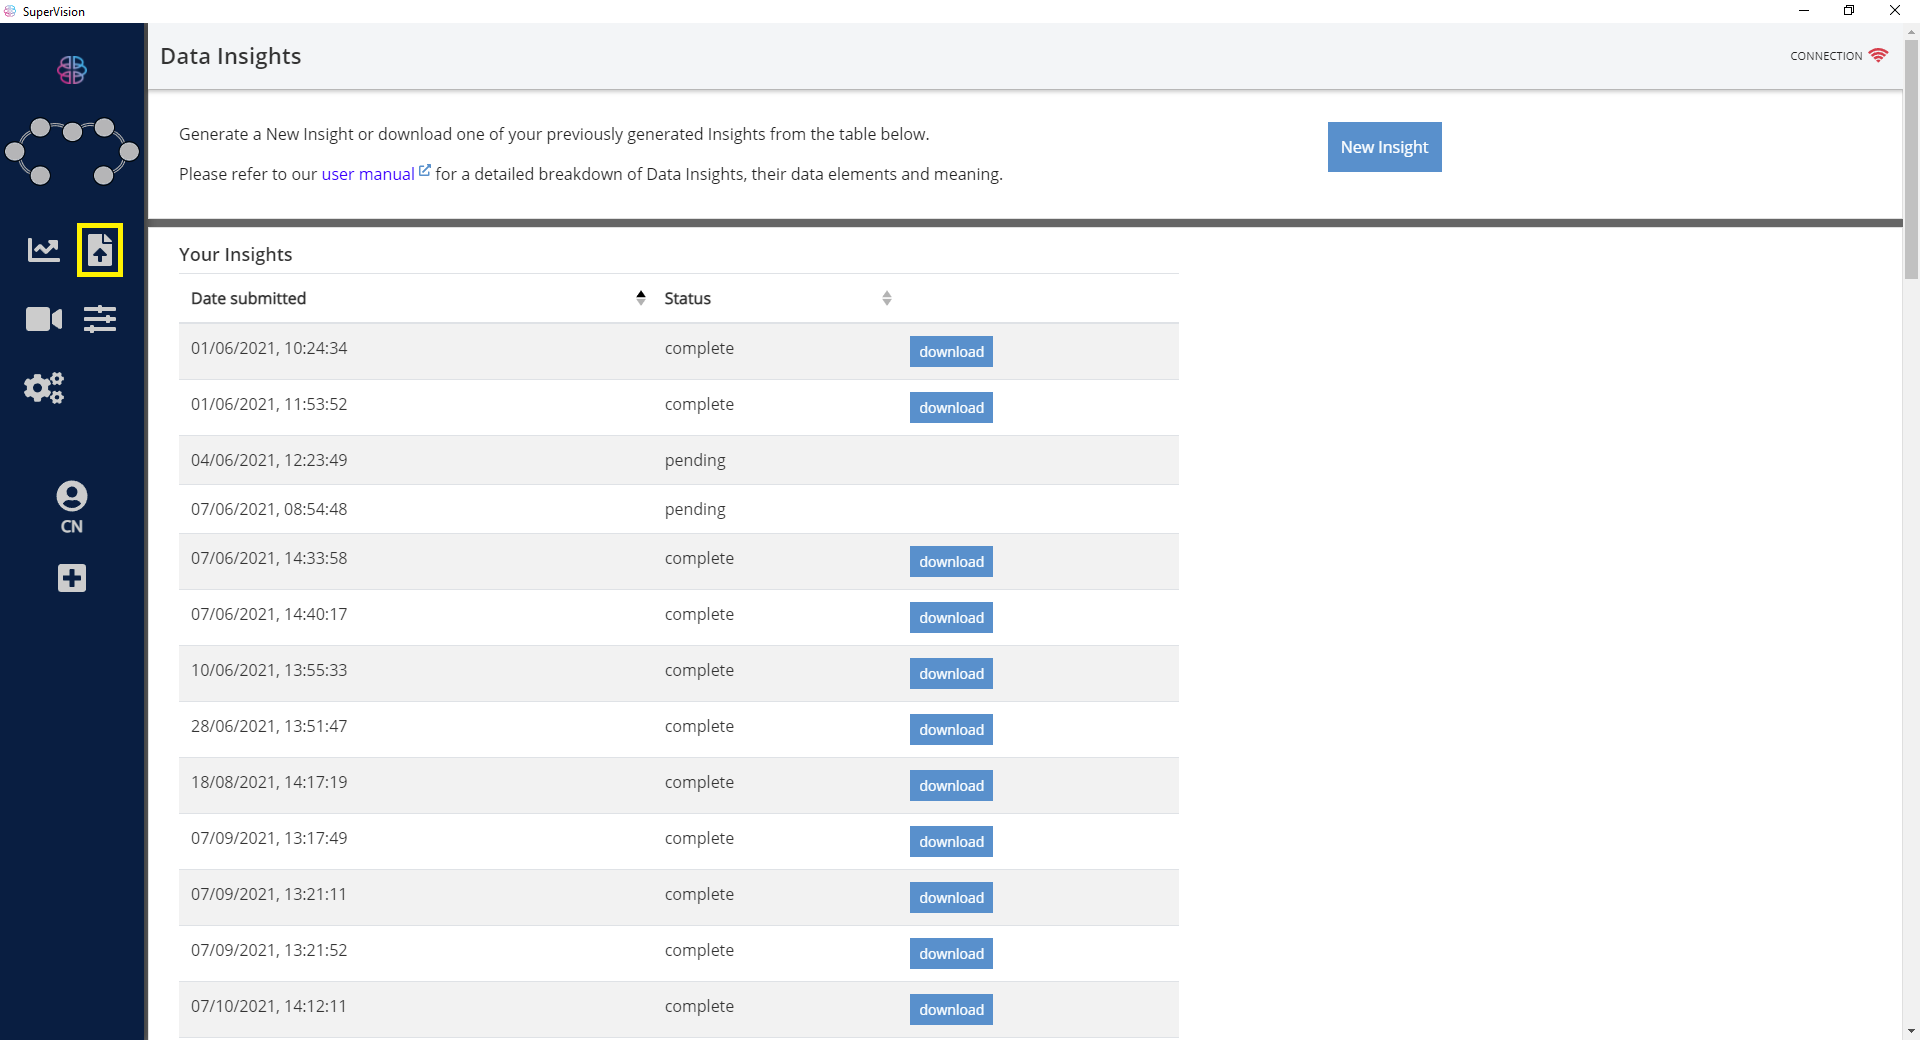
Once you open the Data Insights section you will be greeted with the option to upload new insights at the top, along with a list of the uploads you have made from the current computer.
This functionality is not available to ‘guests’. Users must be logged in to be able to access upload previous uploads and create new ones. If you are not logged in click on the ‘guest’ button the bottom left of the window. Uploaded files are also only accessible from the same computer they were uploaded from currently.
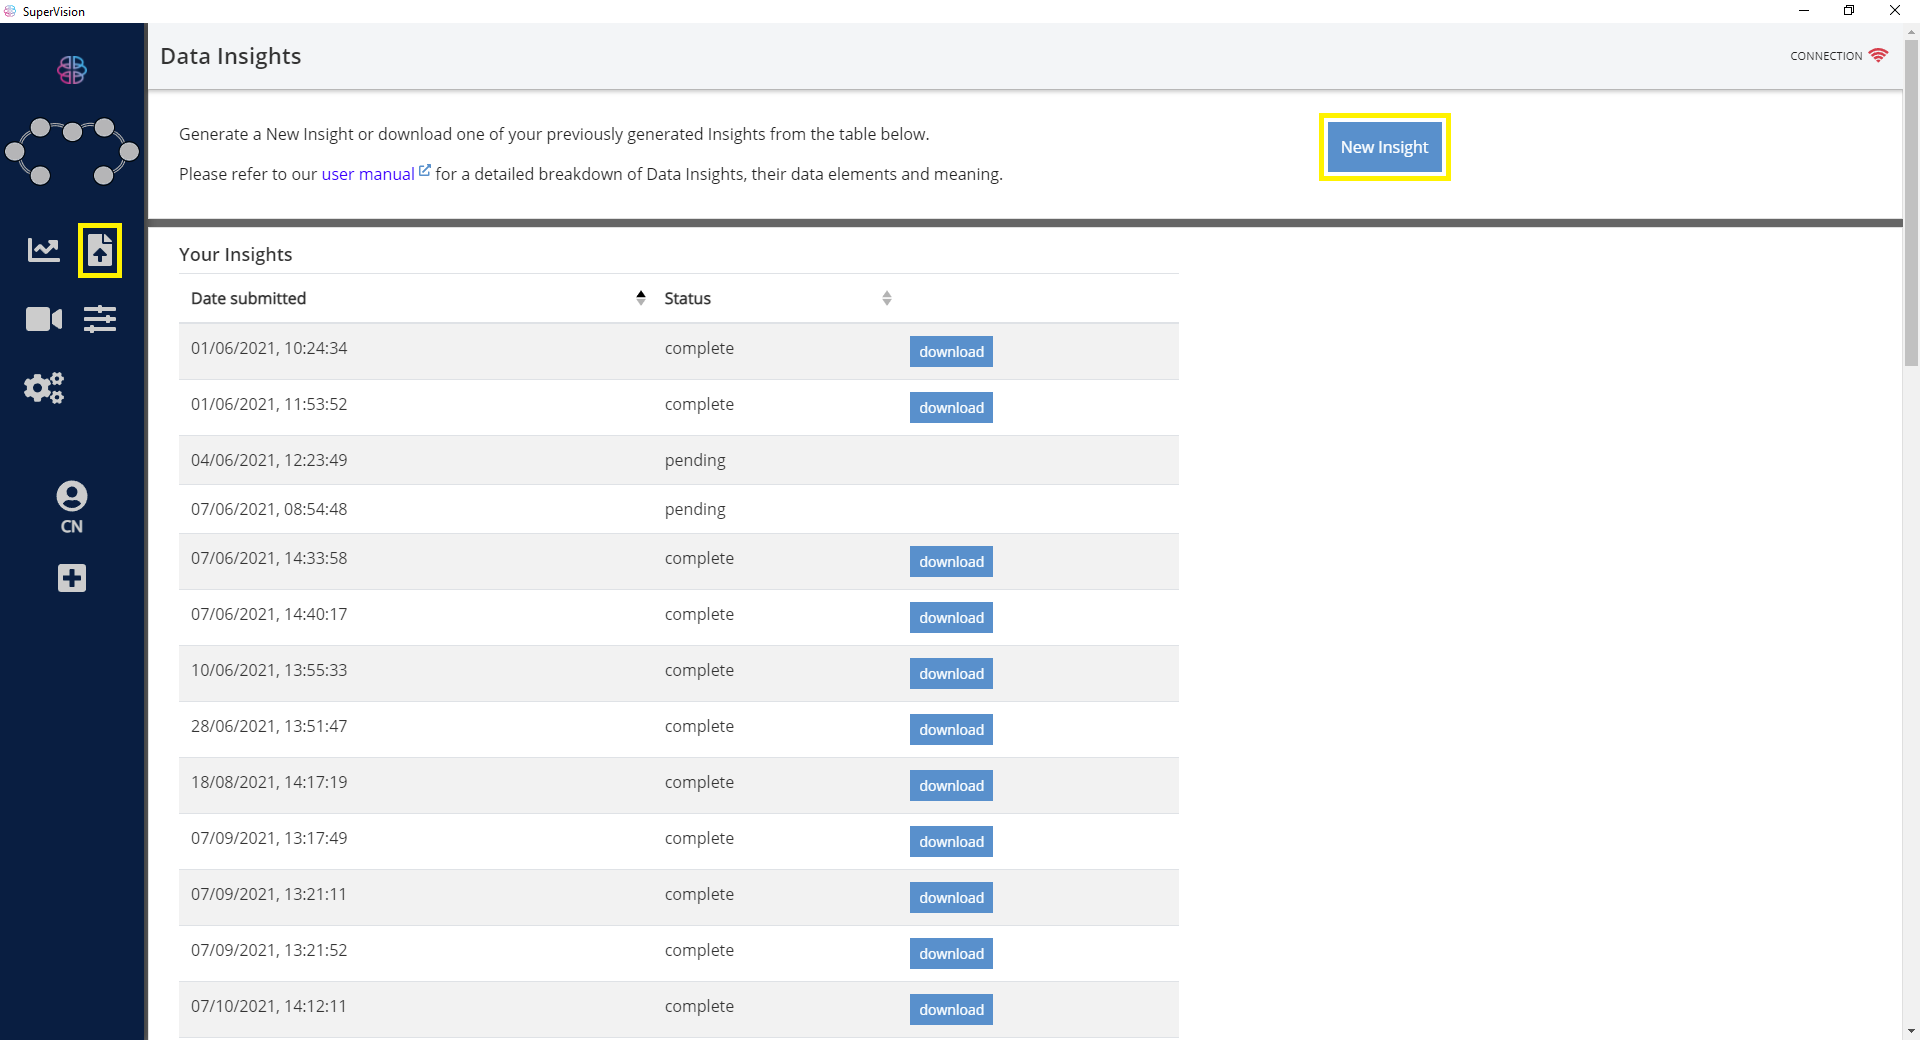
Uploading New Insights
- Begin by clicking File Upload icon on the left and then [New Insight] button highlighted in the image below.
- Specific insight algorithms, and versions of each insight algorithm can be selected prior to upload.
- These selections will impact the content of the returned zip file once processed.
- Following the instructions provided on screen select the
.jsonand.dabfile you wish to upload into the corresponding fields using the [Browse] buttons.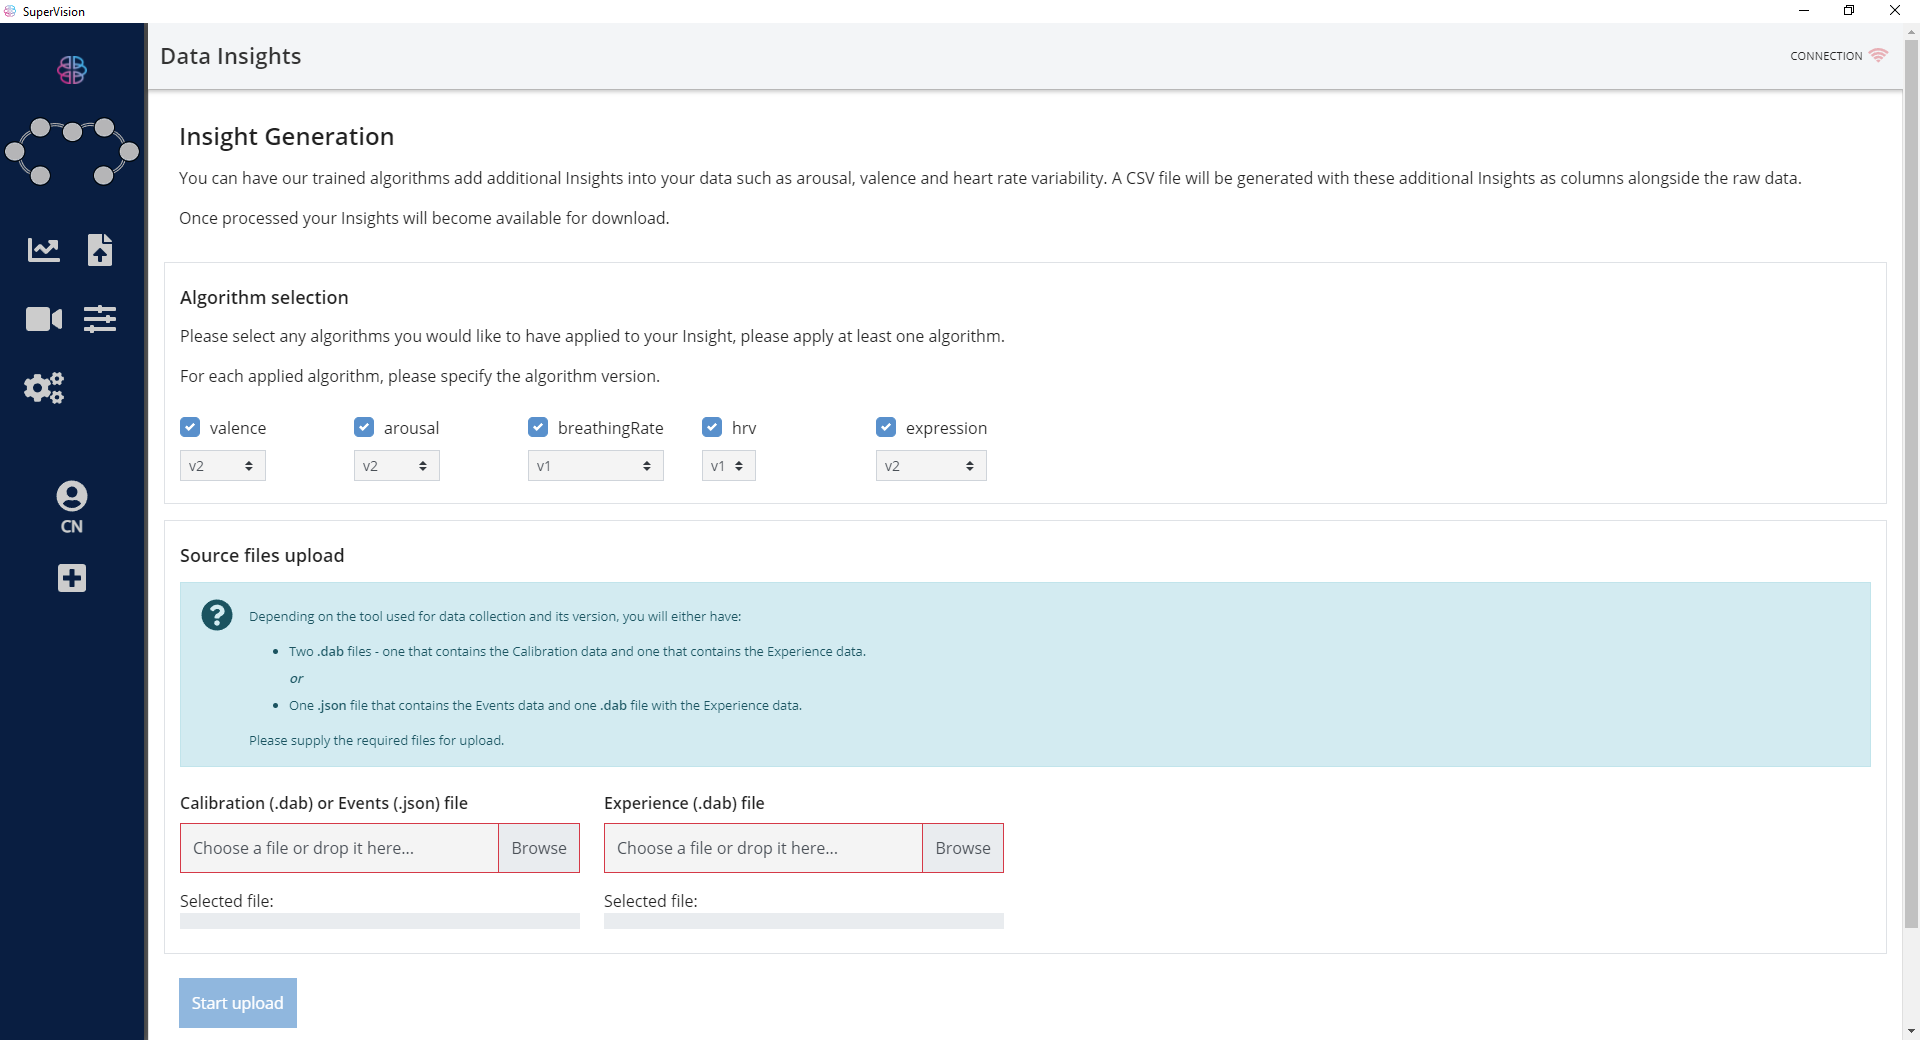
- Once you have selected your files click the [Start Upload] button to begin uploading the files selected.
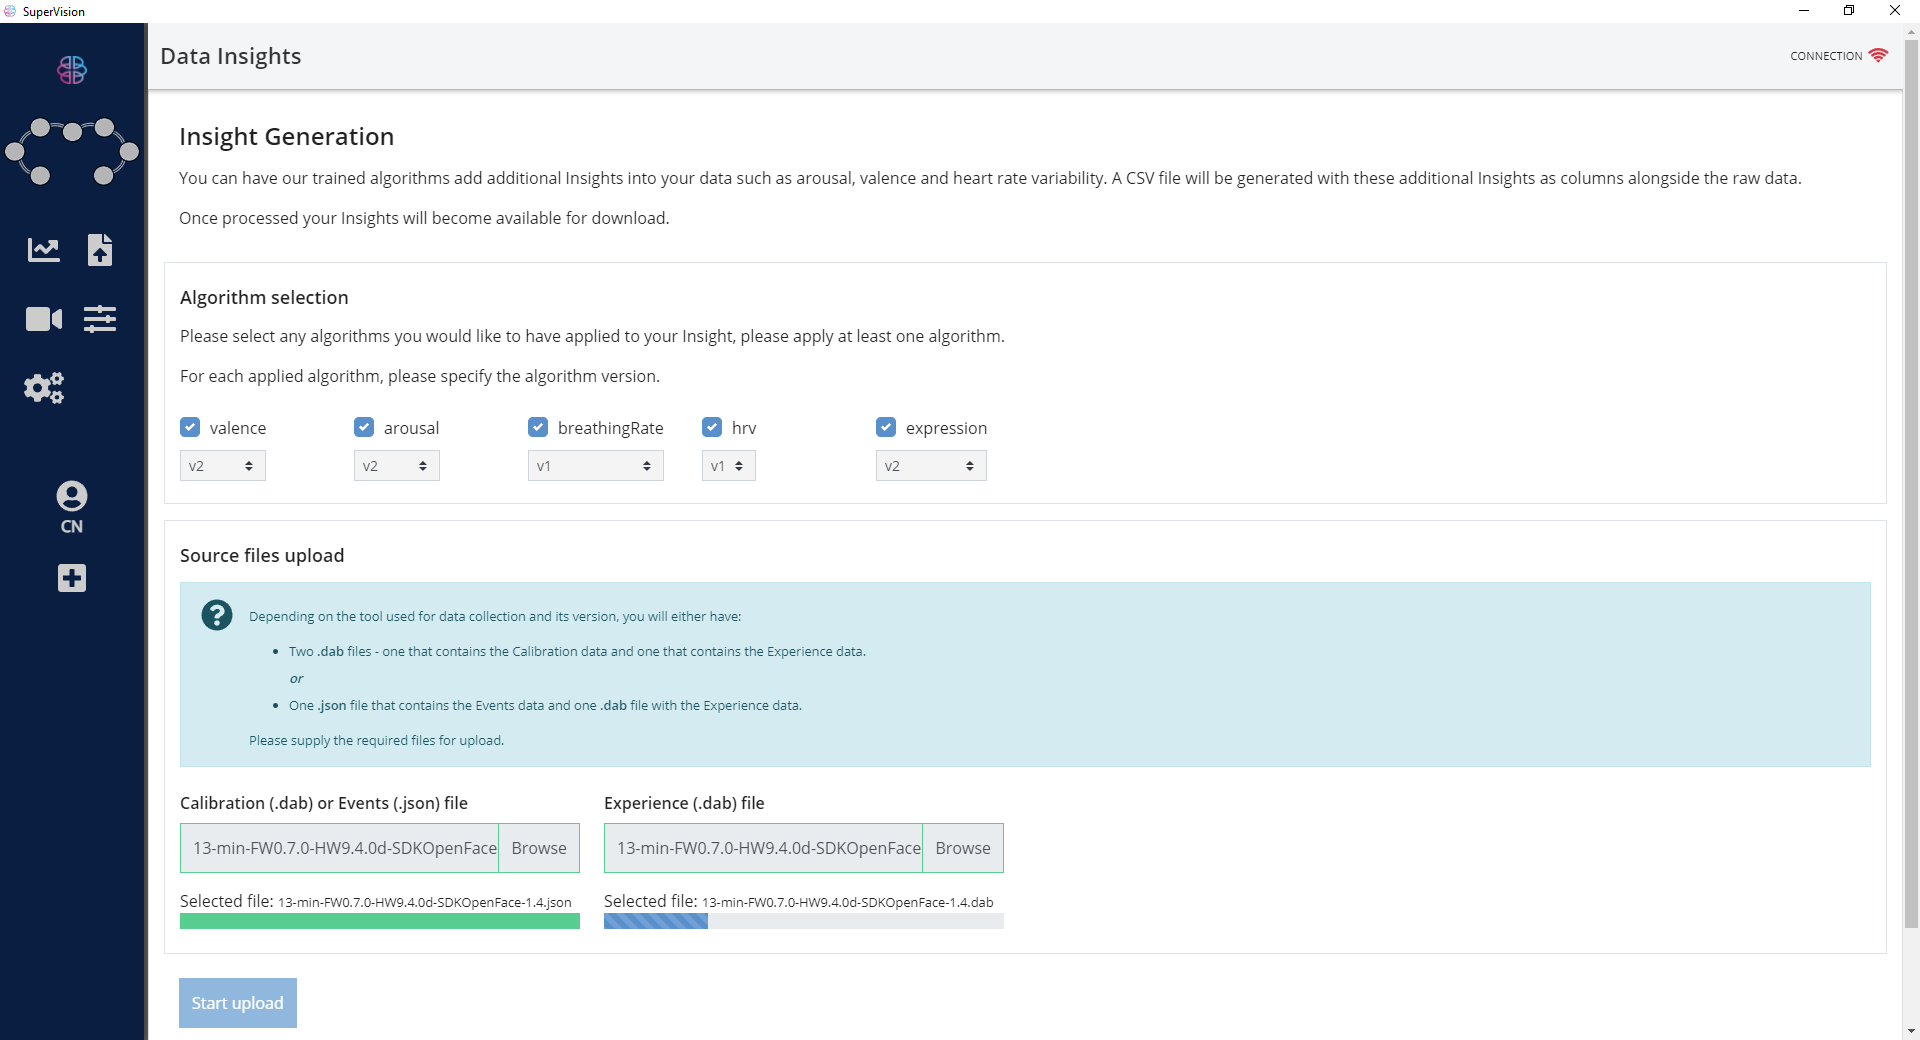
- Once the upload completed you will be returned to the catalogue screen showing all of your uploads along with their status.
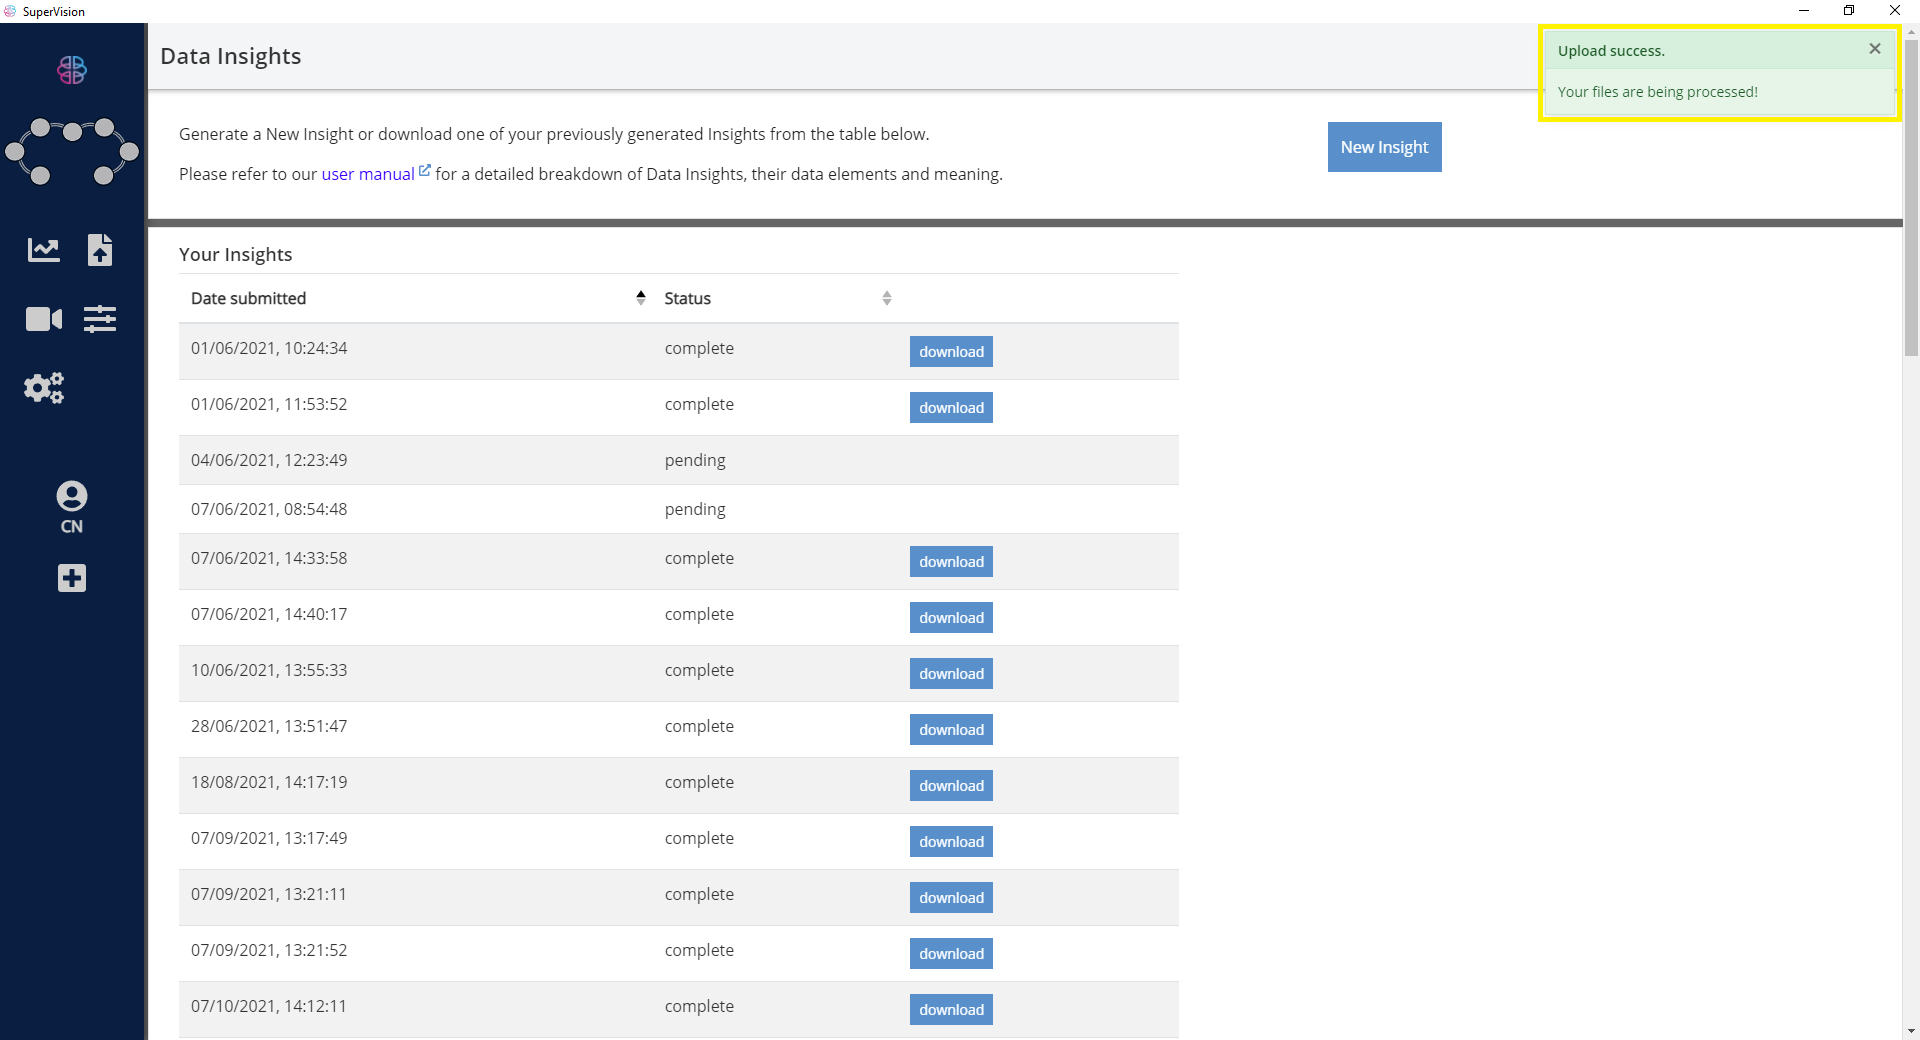
- Depending on the size of the data files you uploaded the time taken to process them will vary.
- Once completed a [download] button will allow you to retrieve the zipped
.csvfile(s).
The CSV Specification is available to help you understand the data shown in this files.
Upload Status
Each item you upload will have a status:
- pending - The upload has been received and is being processed.
- complete - The upload has been successfully processed and a corresponding [download] button will allow you to retrieve the zipped CSV file(s).
- failed - In the event the files are not processed these will be shown as ‘failed', please contact support for assistance.
Remote Viewer
You can also view a video stream of what the participant sees within the application. This includes audio from the Unity App along with the ability view the video in a floating window.
Using the Remote Viewer Service
You must first connect the SuperVision and Unity apps with sensor data streaming to the SuperVision app (i.e. chart data displayed) before starting the Remote Viewer Service. This enables an automatic connection to the video stream once you start the service.
- Assuming you are already running both Unity Application with Core Services and the SuperVision app you can start by selecting the Remote Viewing tab on the left.
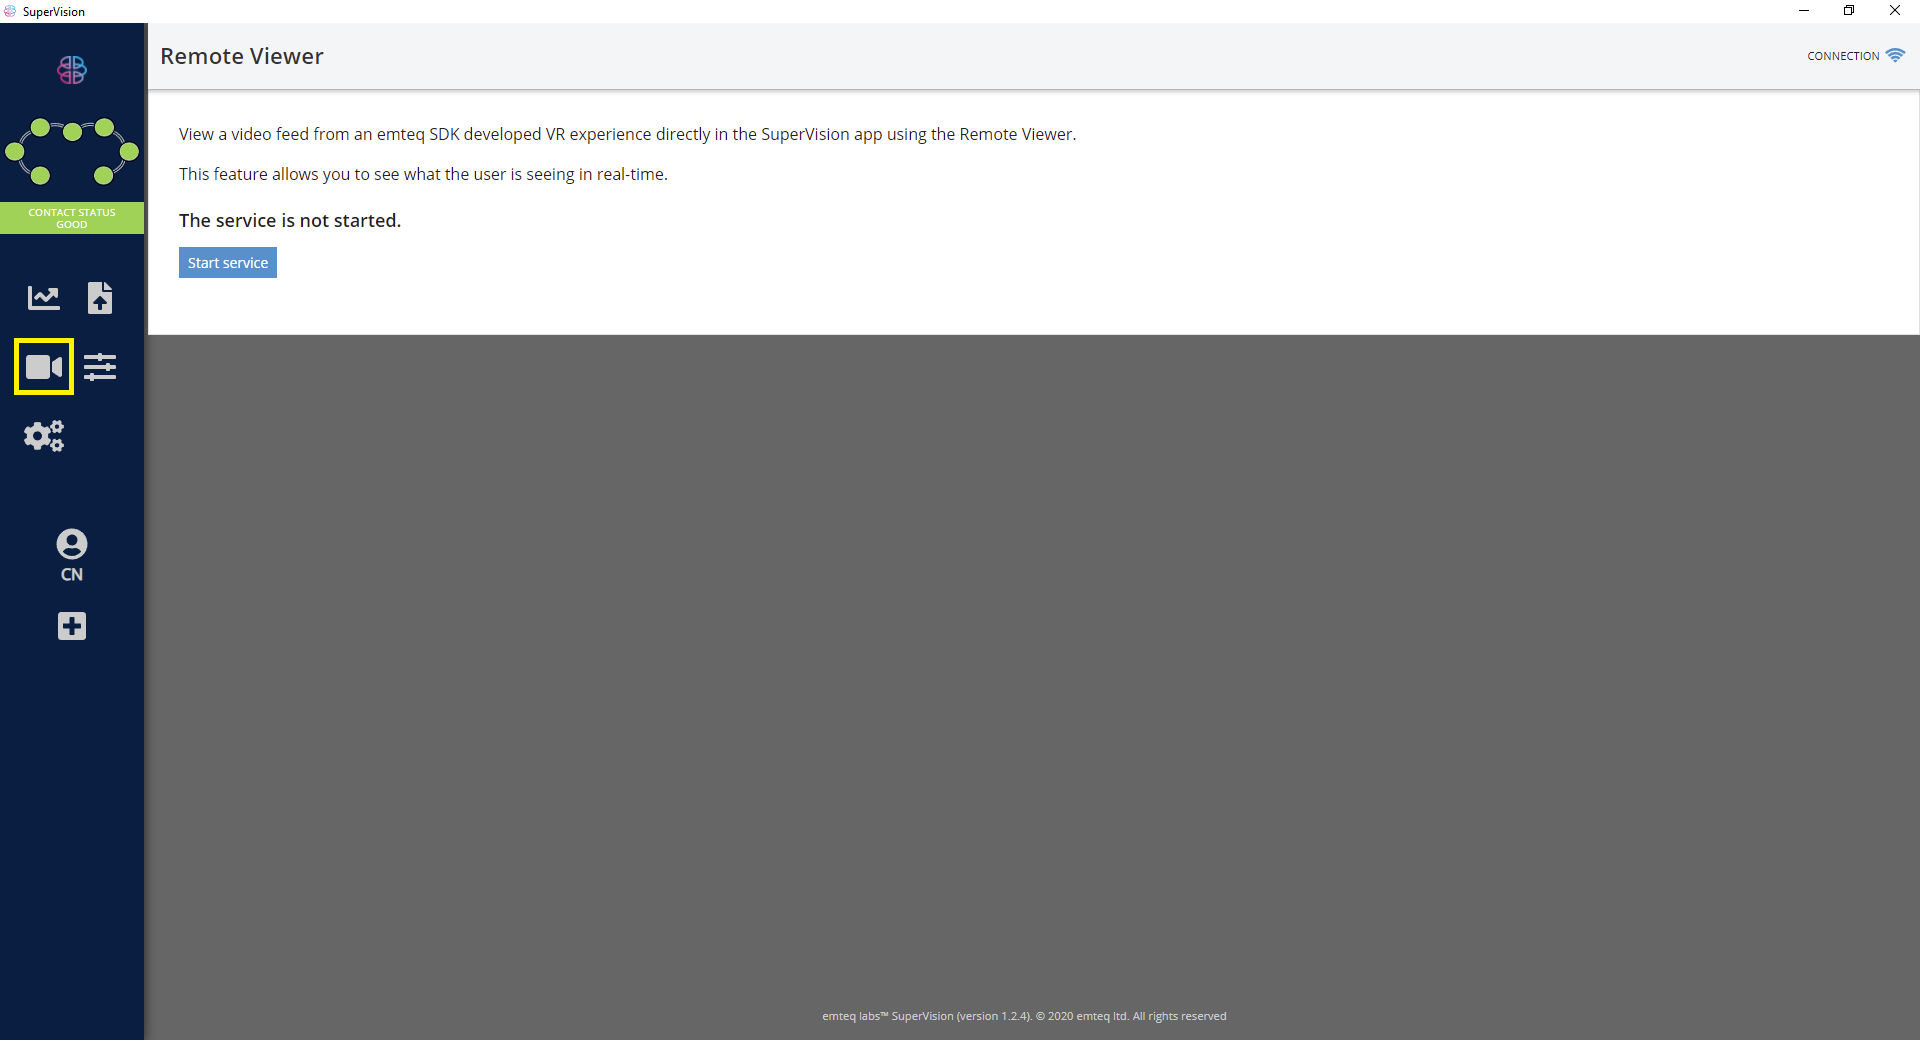
- Click on [Start Service] to being streaming.
- Once the SuperVision app is running you should see the video stream appear in the top left.
- You can use the controls below the video thumbnail to: Close, Mute/Unmute, Pop-out and Full Screen the video stream.
- Once in a separate window the stream can be resized and moved as you wish, the controls for audio remain in the left hand navigation of the main SuperVision window unless running in full screen mode.
- If you are having issues with the stream or are seeing a black screen you can [Restart Viewing Service] to resolve the issue.
- The [Configure] option allows you to view the currently active port used for stream or make changes based on your network requirements.
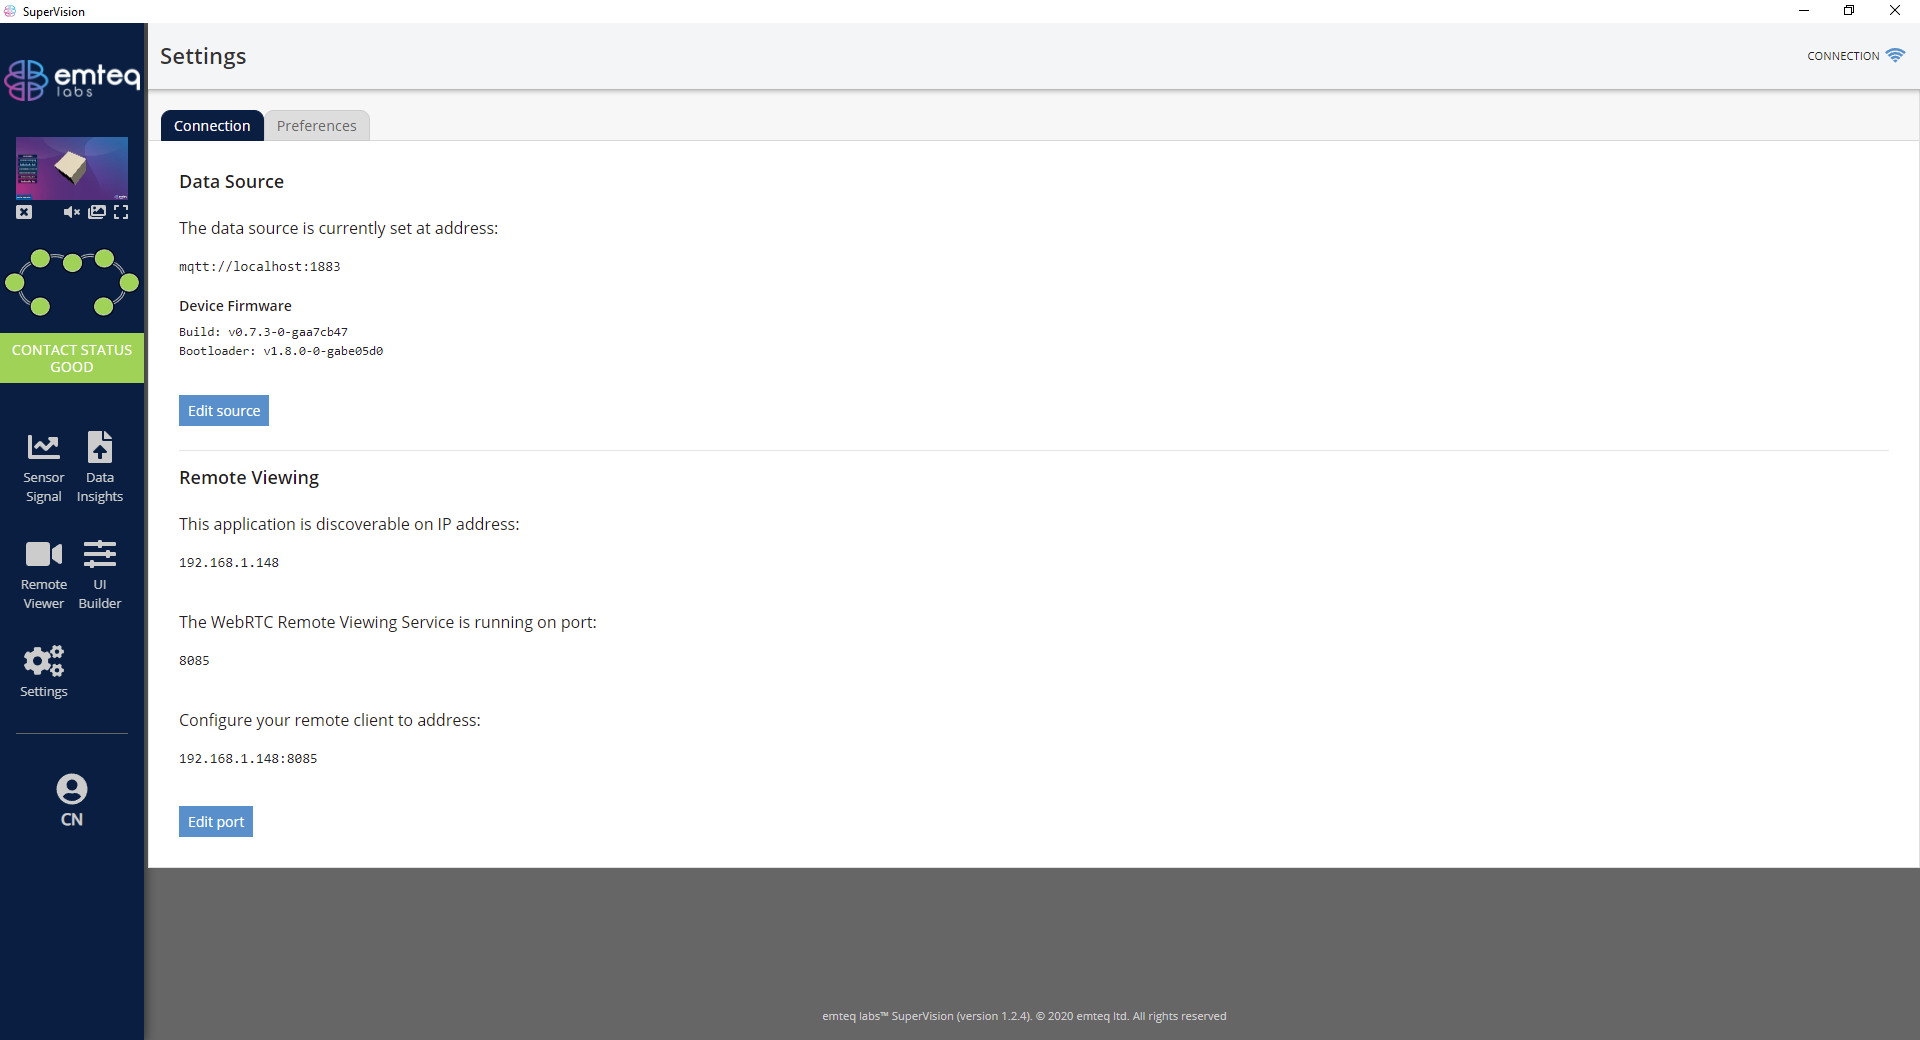
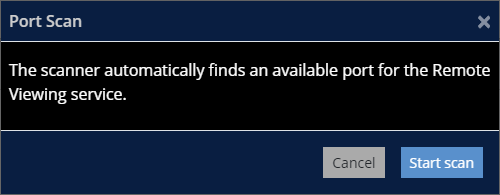
- Clicking on [Edit Port] will expand this section, here you can: Reset to default (port 8085) Auto Scan or enter a manual port number, required to be between 8000-9000.
- Clicking on [Auto Scan] will open a new pop-up window with the option to scan for available port within the range listed above.